Remove DevOps Remove Processing Remove Software Performance Remove Storage
article thumbnail

Automate CI/CD pipelines with Dynatrace: Part 2, Deploy stage

Dynatrace

Even when the staging environment closely mirrors the production environment, achieving a complete replication of all potential scenarios, such as simulating extremely high traffic volumes to assess software performance, remains challenging. This can lead to a lack of insight into how the code will behave when exposed to heavy traffic.

Traffic 261
article thumbnail

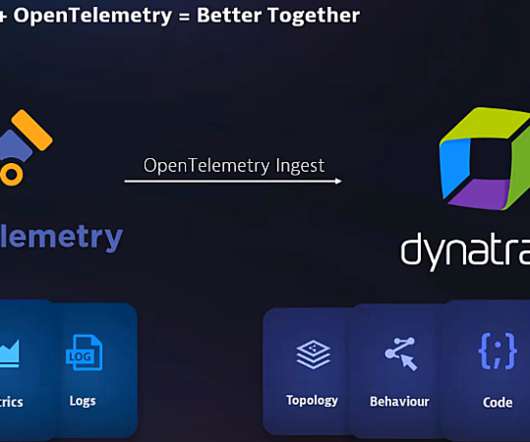
What is? OpenTelemetry??An open-source standard for logs, metrics, and traces

Dynatrace

OpenTelemetry (also referred to as OTel) is an open-source observability framework made up of a collection of tools, APIs, and SDKs, that enables IT teams to instrument, generate, collect, and export telemetry data for analysis and understand software performance and behavior. In-process exporter. Monitoring begins here.

Insiders

Sign Up for our Newsletter

This site is protected by reCAPTCHA and the Google Privacy Policy and Terms of Service apply.

Trending Sources

article thumbnail

Service level objectives: 5 SLOs to get started

Dynatrace

In today’s fast-paced digital landscape, ensuring high-quality software is crucial for organizations to thrive. Service level objectives (SLOs) provide a powerful framework for measuring and maintaining software performance, reliability, and user satisfaction. Latency primarily focuses on the time spent in transit.

Latency 176
article thumbnail

Service level objective examples: 5 SLO examples for faster, more reliable apps

Dynatrace

In today’s fast-paced digital landscape, ensuring high-quality software is crucial for organizations to thrive. Service level objectives (SLOs) provide a powerful framework for measuring and maintaining software performance, reliability, and user satisfaction. Latency primarily focuses on the time spent in transit.

Traffic 173
article thumbnail

Observability platform vs. observability tools

Dynatrace

Metrics are measures of critical system values, such as CPU utilization or average write latency to persistent storage. Traces provide performance data about tasks that are performed by invoking a series of services. A database could start executing a storage management process that consumes database server resources.