article thumbnail

The road to observability demo part 3: Collect, instrument, and analyze telemetry data automatically with Dynatrace

Dynatrace

OpenTelemetry , the open source observability tool, has become the go-to standard for instrumenting custom applications to collect observability telemetry data. We also introduced our demo app and explained how to define the metrics and traces it uses. Register now!

Metrics 171
article thumbnail

Open Source at AWS re:Invent

Adrian Cockcroft

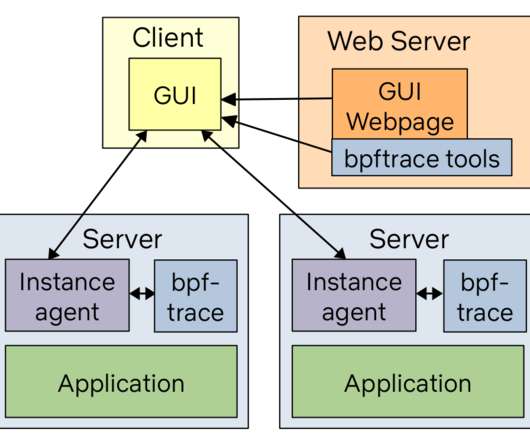
We’re excited to let you know that we have an Open Source track at re:Invent this year! Brendan Gregg tours BPF tracing, with open source tools & examples for EC2 instance analysis. OPN304 Learnings from migrating a service from JDK 8 to JDK 11 AWS Lambda improved latency by migrating to JDK 11 with Amazon Corretto.

Insiders

Sign Up for our Newsletter

This site is protected by reCAPTCHA and the Google Privacy Policy and Terms of Service apply.

Trending Sources

article thumbnail

Open Source at AWS re:Invent

Adrian Cockcroft

We’re excited to let you know that we have an Open Source track at re:Invent this year! Brendan Gregg tours BPF tracing, with open source tools & examples for EC2 instance analysis. OPN304 Learnings from migrating a service from JDK 8 to JDK 11 AWS Lambda improved latency by migrating to JDK 11 with Amazon Corretto.

article thumbnail

What is full stack observability?

Dynatrace

Endpoints include on-premises servers, Kubernetes infrastructure, cloud-hosted infrastructure and services, and open-source technologies. Observability can identify the baseline user experience and allow teams to improve it by optimizing page load times or reducing latency. Why full-stack observability matters.

DevOps 231
article thumbnail

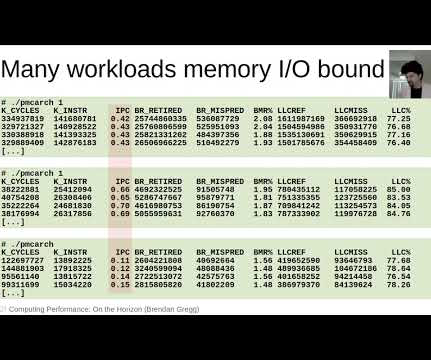
USENIX LISA2021 Computing Performance: On the Horizon

Brendan Gregg

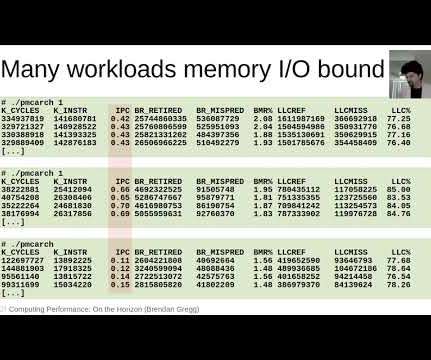
## References I've reproduced the talk references below, so you can click on links: - [Gregg 08] Brendan Gregg, “ZFS L2ARC,” [link] Jul 2008 - [Gregg 10] Brendan Gregg, “Visualizations for Performance Analysis (and More),” [link] 2010 - [Greenberg 11] Marc Greenberg, “DDR4: Double the speed, double the latency? Ford, et al., “TCP

article thumbnail

Observability platform vs. observability tools

Dynatrace

Metrics are measures of critical system values, such as CPU utilization or average write latency to persistent storage. The open-source observability framework, OpenTelemetry , provides a standard for adding observable instrumentation to cloud-native applications. Watch webinar now!

article thumbnail

USENIX SREcon APAC 2022: Computing Performance: What's on the Horizon

Brendan Gregg

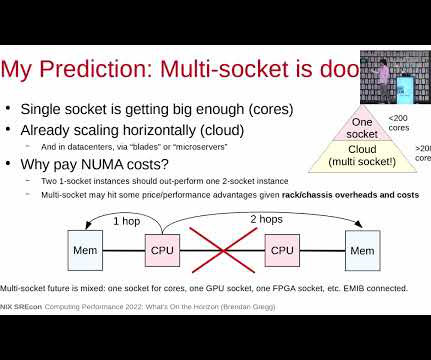
My personal opinion is that I don't see a widespread need for more capacity given horizontal scaling and servers that can already exceed 1 Tbyte of DRAM; bandwidth is also helpful, but I'd be concerned about the increased latency for adding a hop to more memory. Ford, et al., “TCP