article thumbnail

A guide to event-driven SRE-inspired DevOps

Dynatrace

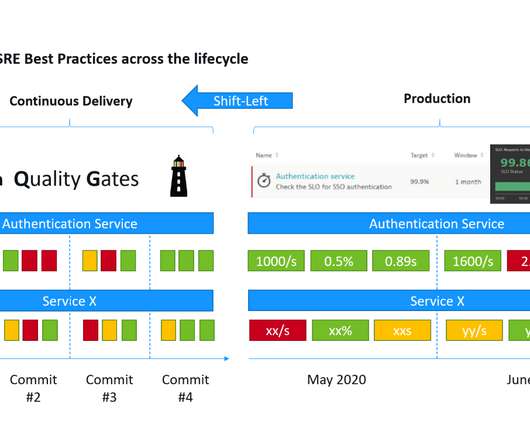
If you’re not familiar with Site Reliability Engineering (SRE) and the concepts of Service Level Indicators (SLIs), Service Level Objectives (SLOs) and Service Level Agreements (SLAs) I recommend watching the YouTube Video from Google Engineers called SLIs, SLOs, SLAs, oh my! class SRE implements DevOps) !

DevOps 242
article thumbnail

Increase the Performance of your Site with Lazy-Loading and Code-Splitting

Jos

Or loading a 3rd party component like a Google Map, with all its additional assets needed to render the thing? A code coverage report, like the one Google Chrome provides won’t help us much. Code coverage tab on Google Chrome ( source ). When it comes to SEO, you might have issues indexing lazy-loaded content on Google.

Code 130
Insiders

Sign Up for our Newsletter

This site is protected by reCAPTCHA and the Google Privacy Policy and Terms of Service apply.

Trending Sources

article thumbnail

Why is Wordpress Slow?

KeyCDN

Several website speed testing tools available could be used for this purpose. KeyCDN Website Speed Test, GTmetrix, Google PageSpeed Insights, WebPageTest, and Pingdom Tools are some great choices. We test the home page of a WordPress website using the Website Speed Test.

Cache 52
article thumbnail

Front-End Performance Checklist 2021

Smashing Magazine

Assets Optimizations Brotli, AVIF, WebP, responsive images, AV1, adaptive media loding, video compression, web fonts, Google fonts. Run performance experiments and measure outcomes — both on mobile and on desktop (for example, with Google Analytics ). For each of them, Google recommends a range of acceptable speed goals.

article thumbnail

Front-End Performance Checklist 2020 [PDF, Apple Pages, MS Word]

Smashing Magazine

Run performance experiments and measure outcomes — both on mobile and on desktop (for example, with Google Analytics ). Real User Monitoring ( RUM ) tools evaluate user interactions continuously and collect field data (e.g. synthetic testing tools and RUM together provide a complete picture of performance in your application.

article thumbnail

Front-End Performance Checklist 2019 [PDF, Apple Pages, MS Word]

Smashing Magazine

Keep in mind that a good performance picture covers a set of performance metrics, lab data and field data : Synthetic testing tools collect lab data in a reproducible environment with predefined device and network settings (e.g. Real User Monitoring ( RUM ) tools evaluate user interactions continuously and collect field data (e.g.