Remove Cache Remove Database Remove Performance Testing Remove Servers
article thumbnail

Key Performance Measurements for App Servers: Cause, Impact, and Resolution

DZone

Below are some of the key metrics that need to be monitored during performance testing: CPU utilization. Server page faults/second. Cache hit ratio. Let's take a look at some of the causes of negative impacts on performance testing and some quick resolutions that will help smooth everything out.

Servers 133
article thumbnail

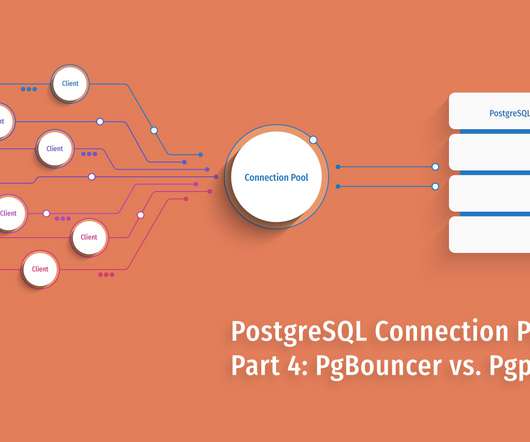
PostgreSQL Connection Pooling: Part 4 – PgBouncer vs. Pgpool-II

Scalegrid

PgBouncer defines one pool per user+database combination. A client benefits from a pooled connection only if it connects to a child which has previously served a connection for this database+user combination. PgBouncer allows limiting connections per-pool, per-database, per-user or per-client. Performance Testing.

Insiders

Sign Up for our Newsletter

This site is protected by reCAPTCHA and the Google Privacy Policy and Terms of Service apply.

Trending Sources

article thumbnail

SQL Server I/O Basics Chapter #1

SQL Server According to Bob

Microsoft SQL Server I/O Basics Author: ​​ Bob Dorr, Microsoft SQL Server Escalation Published: ​​ December, 2004 SUMMARY: ​​ Learn the I/O requirements for Microsoft SQL Server database file operations. Then follow the instructions to either download the BOL or browse online.

Servers 40
article thumbnail

An approach to index tuning – Part 2

SQL Performance

His version can be used for the plan cache – the only challenge there is the information is transient, so you may not capture every query that uses a particular index. value ( '(@Database) [1 ]' , 'varchar(128)' ) AS DatabaseName , obj. value ( '(@StatementText) [1 ]' , 'varchar(max)' ) AS SQL_Text , obj. nodes ( '.

Tuning 137
article thumbnail

Front-End Performance Checklist 2020 [PDF, Apple Pages, MS Word]

Smashing Magazine

Is it worth exploring tree-shaking, scope hoisting, code-splitting, and all the fancy loading patterns with intersection observer, server push, clients hints, HTTP/2, service workers and — oh my — edge workers? It used to provide an insight into how quickly the server outputs any data. What does it mean?

article thumbnail

Front-End Performance Checklist 2019 [PDF, Apple Pages, MS Word]

Smashing Magazine

Is it worth exploring tree-shaking, scope hoisting, code-splitting, and all the fancy loading patterns with intersection observer, server push, clients hints, HTTP/2, service workers and — oh my — edge workers? Long FMP usually indicates JavaScript blocking the main thread, but could be related to back-end/server issues as well.

article thumbnail

AWS EKS Monitoring as a Self-Service with Dynatrace

Dynatrace

REDIS for caching. Once Dynatrace OneAgent is monitoring the k8s cluster it gives you code-level visibility into every container that gets deployed including visibility into each incoming service call, executed database queries, invoked external services, written logs as well as handled and unhandled exceptions. #1 3 Log Analytics.

AWS 127