Remove Best Practices Remove Latency Remove Metrics Remove Video
article thumbnail

Best practices and key metrics for improving mobile app performance

Dynatrace

As a result, organizations need to monitor mobile app performance metrics that are meaningful and actionable by gaining adequate observability of mobile app performance. There are many common mobile app performance metrics that are used to measure key performance indicators (KPIs) related to user experience and satisfaction.

article thumbnail

Implementing service-level objectives to improve software quality

Dynatrace

By implementing service-level objectives, teams can avoid collecting and checking a huge amount of metrics for each service. In what follows, we explore some of these best practices and guidance for implementing service-level objectives in your monitored environment. Best practices for implementing service-level objectives.

Software 259
Insiders

Sign Up for our Newsletter

This site is protected by reCAPTCHA and the Google Privacy Policy and Terms of Service apply.

Trending Sources

article thumbnail

Service level objectives: 5 SLOs to get started

Dynatrace

Certain SLOs can help organizations get started on measuring and delivering metrics that matter. With this objective, the app ensures that users experience real-time feedback and immediate updates when logging workouts, recording sets and reps, or tracking performance metrics. Latency primarily focuses on the time spent in transit.

Latency 174
article thumbnail

Service level objective examples: 5 SLO examples for faster, more reliable apps

Dynatrace

Certain service-level objective examples can help organizations get started on measuring and delivering metrics that matter. With this objective, the app ensures that users experience real-time feedback and immediate updates when logging workouts, recording sets and reps, or tracking performance metrics. The Apdex score of 0.85

Traffic 173
article thumbnail

What is real user monitoring (RUM)?

Dynatrace

Real user monitoring collects data on a variety of metrics. For example, data collected on load actions can include navigation start, request start, and speed index metrics. Real user monitoring works by injecting code into an application to capture metrics while the application is in use. Best practices for RUM.

article thumbnail

Data Reprocessing Pipeline in Asset Management Platform @Netflix

The Netflix TechBlog

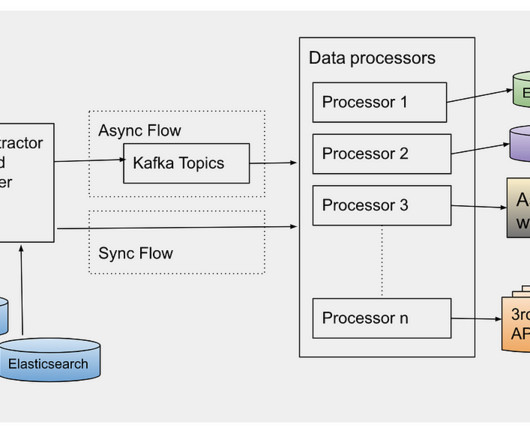
Data Sharding strategy in elasticsearch is updated to provide low search latency (as described in blog post) Design of new Cassandra reverse indices to support different sets of queries. We collect the failure metrics to be checked and fixed later. We are using the Netflix Atlas framework to collect and monitor such metrics.

Media 237
article thumbnail

A Complete Guide to Performance Budgets

Speed Curve

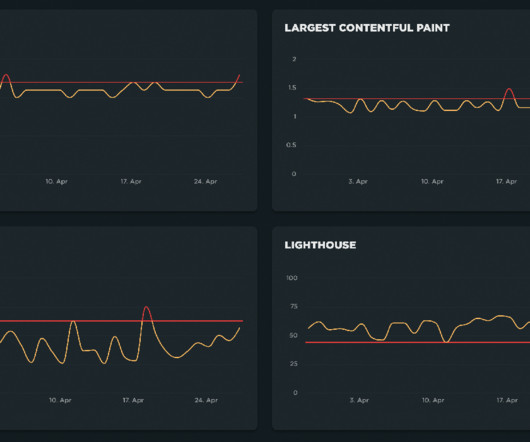
A performance budget is a threshold that you apply to the metrics you care about the most. A good performance budget chart, such as the one above, should show you: The metric you're tracking The threshold you've created for that metric When you exceed that threshold How long you stayed out of bounds When you returned to below the threshold 3.