Remove Benchmarking Remove Storage Remove Traffic Remove Video
article thumbnail

Building Netflix’s Distributed Tracing Infrastructure

The Netflix TechBlog

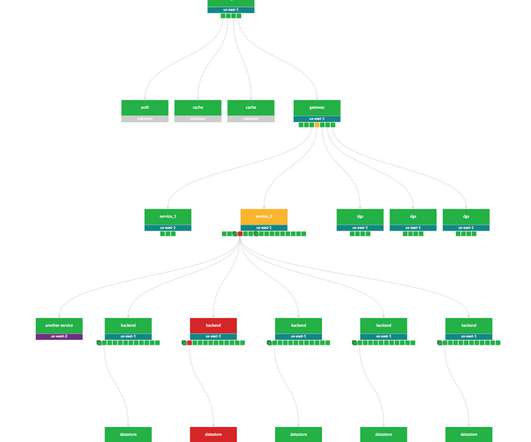
Investigating a video streaming failure consists of inspecting all aspects of a member account. Our distributed tracing infrastructure is grouped into three sections: tracer library instrumentation, stream processing, and storage. Storage: don’t break the bank! which is difficult when troubleshooting distributed systems.

article thumbnail

The Importance of Selecting the Proper Azure VM Size

SQL Performance

IT professionals are familiar with scoping the size of VMs with regards to vCPU, memory, and storage capacity. Compute optimized – High CPU-to-memory ration, medium traffic web servers and application servers. Storage optimized – High disk throughput and IO. GPU – Heavy graphic rendering and video editing. Generation.

Azure 76
Insiders

Sign Up for our Newsletter

This site is protected by reCAPTCHA and the Google Privacy Policy and Terms of Service apply.

Trending Sources

article thumbnail

Edgar: Solving Mysteries Faster with Observability

The Netflix TechBlog

Edgar captures 100% of interesting traces , as opposed to sampling a small fixed percentage of traffic. This difference has substantial technological implications, from the classification of what’s interesting to transport to cost-effective storage (keep an eye out for later Netflix Tech Blog posts addressing these topics).

Latency 296
article thumbnail

Front-End Performance Checklist 2021

Smashing Magazine

Assets Optimizations Brotli, AVIF, WebP, responsive images, AV1, adaptive media loding, video compression, web fonts, Google fonts. CrUX generates an overview of performance distributions over time, with traffic collected from Google Chrome users. You can then mimic the 90th percentile’s experience for testing. Large preview ).

article thumbnail

Front-End Performance Checklist 2020 [PDF, Apple Pages, MS Word]

Smashing Magazine

To get a good first impression of how your competitors perform, you can use Chrome UX Report ( CrUX , a ready-made RUM data set, video introduction by Ilya Grigorik and detailed guide by Rick Viscomi) or Treo Sites , a RUM monitoring tool that is powered by Chrome UX Report. You can then mimic the 90th percentile’s experience for testing.