Remove c
article thumbnail

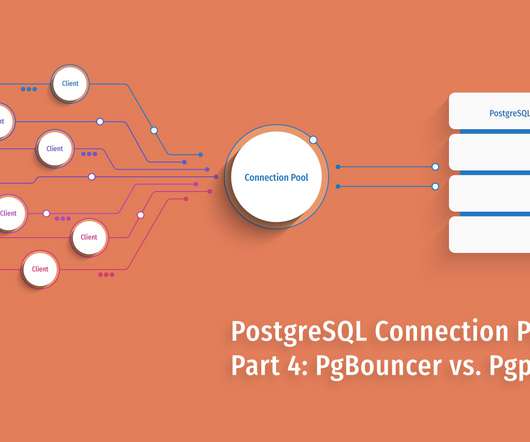
PostgreSQL Connection Pooling: Part 4 – PgBouncer vs. Pgpool-II

Scalegrid

PgBouncer defines one pool per user+database combination. A client benefits from a pooled connection only if it connects to a child which has previously served a connection for this database+user combination. PgBouncer allows limiting connections per-pool, per-database, per-user or per-client. Performance Testing.

article thumbnail

Real Time Oracle Performance Monitoring for Benchmarks

HammerDB

An essential part of database performance testing is viewing the statistics generated by the database during the test and in 2009 HammerDB introduced automatic AWR snapshot generation for Oracle for the TPC-C test. In this example a test with 2 minute rampup and 5 minute test time can be seen.

Insiders

Sign Up for our Newsletter

This site is protected by reCAPTCHA and the Google Privacy Policy and Terms of Service apply.

Trending Sources

article thumbnail

What Adrian Did Next?—?Part 2?—?Sun Microsystems

Adrian Cockcroft

Another big jump, but now it was my job to run benchmarks in the lab, and write white papers that explained the new products to the world, as they were launched. I was mostly coding in C, tuning FORTRAN, and when I needed to do a lot of data analysis of benchmark results used the S-PLUS statistics language, that is the predecessor to R.

Tuning 52
article thumbnail

HammerDB MySQL and MariaDB Best Practice for Performance and Scalability

HammerDB

This post complements the previous best practice guides this time with the focus on MySQL and MariaDB and achieving top levels of performance with the HammerDB MySQL TPC-C test. Similarly for this guide MySQL can be swapped for a mySQL based databases such as MariaDB. SELECT DISTINCT c from sbtest where id between ?

article thumbnail

KPTI/KAISER Meltdown Initial Performance Regressions

Brendan Gregg

I then analyzed performance during the benchmark ([active benchmarking]), and used other benchmarks to confirm findings. Plotting the percent performance loss vs syscall rate per CPU, for my microbenchmark: Applications that have high syscall rates include proxies, databases, and others that do lots of tiny I/O.

article thumbnail

Front-End Performance Checklist 2020 [PDF, Apple Pages, MS Word]

Smashing Magazine

Geekbench CPU performance benchmarks for the highest selling smartphones globally in 2019. JavaScript stresses single-core performance (remember, it’s inherently more single-threaded than the rest of the Web Platform) and is CPU bound. Test with network throttling, and emulate a high-DPI device.