Remove Artificial Intelligence Remove DevOps Remove Metrics Remove Storage
article thumbnail

What is predictive AI? How this data-driven technique gives foresight to IT teams

Dynatrace

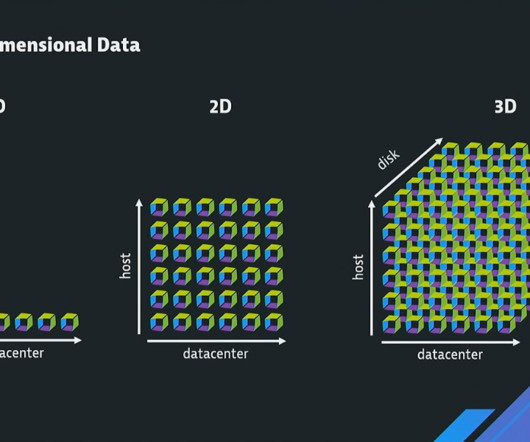
Therefore, the integration of predictive artificial intelligence (AI) in the workflows of these teams has become essential to meet service-level objectives, collaborate effectively, and boost productivity. Through predictive analytics, SREs and DevOps engineers can accurately forecast resource needs based on historical data.

article thumbnail

AWS re:Invent 2023 guide: Generative AI takes a front seat

Dynatrace

Causal AI is an artificial intelligence technique used to determine the precise underlying causes and effects of events. Using What is artificial intelligence? So, what is artificial intelligence? The short answer: The three pillars of observability—logs, metrics, and traces—concentrated in a data lakehouse.

AWS 214
Insiders

Sign Up for our Newsletter

This site is protected by reCAPTCHA and the Google Privacy Policy and Terms of Service apply.

Trending Sources

article thumbnail

What is ITOps? Why IT operations is more crucial than ever in a multicloud world

Dynatrace

Besides the traditional system hardware, storage, routers, and software, ITOps also includes virtual components of the network and cloud infrastructure. ITOps vs. DevOps and DevSecOps. DevOps works in conjunction with IT. The primary goal of ITOps is to provide a high-performing, consistent IT environment. ITOps vs. AIOps.

article thumbnail

Redis® Monitoring Strategies for 2024

Scalegrid

Buckle up as we delve into the world of Redis® monitoring, exploring the most important Redis® metrics, discussing essential tools, and even peering into the future of Redis® performance management. Identifying key Redis® metrics such as latency, CPU usage, and memory metrics is crucial for effective Redis monitoring.

Strategy 130
article thumbnail

Observability platform vs. observability tools

Dynatrace

Observability is made up of three key pillars: metrics, logs, and traces. Metrics are measures of critical system values, such as CPU utilization or average write latency to persistent storage. Observability tools, such as metrics monitoring, log viewers, and tracing applications, are relatively small in scope.

article thumbnail

Why log monitoring and log analytics matter in a hyperscale world

Dynatrace

DevOps teams often use a log monitoring solution to ingest application, service, and system logs so they can detect issues at any phase of the software delivery life cycle (SDLC). With clear insight into crucial system metrics, teams can automate more processes and responses with greater precision. More automation.

Analytics 214
article thumbnail

Why you need Dynatrace on Azure Workloads

Dynatrace

Microsoft offers a wide variety of tools to monitor applications deployed within Microsoft Azure, and the Azure Monitor suite includes several integration points into the enterprise applications, including: VM agent – Collects logs and metrics from the guest OS of virtual machines. Available as an agent installer). How does Dynatrace fit in?

Azure 139