Remove Analytics Remove Benchmarking Remove Ecommerce Remove Speed
article thumbnail

Why you need to know your site's performance poverty line (and how to find it)

Speed Curve

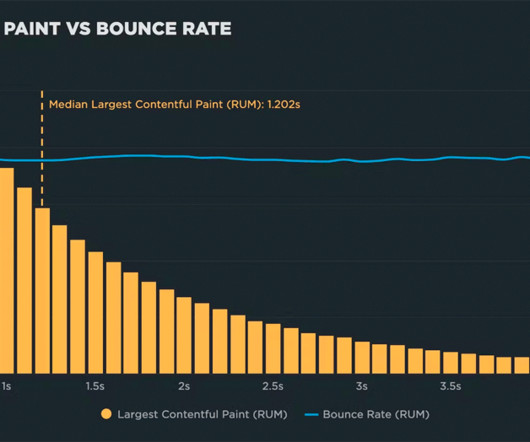
Poverty lines emerged for both Start Render and Largest Contentful Paint I expected the results for Start Render, as it's been around as a page speed metric for many years, and has been proven to correlate to business metrics. The blue bar represents the change in bounce rate across all cohorts. Ultimately, this is good for your business.

article thumbnail

Why you need to know your site's performance plateau (and how to find it)

Speed Curve

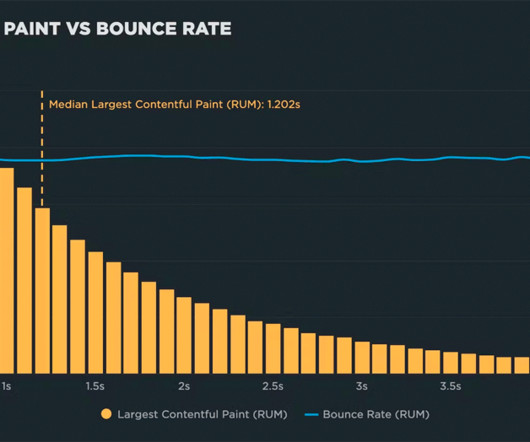
Plateaus emerged for both Start Render and Largest Contentful Paint I expected the results for Start Render, as it's been around as a page speed metric for many years, and has been proven to correlate to business metrics. The blue bar represents the change in bounce rate across all cohorts. Ultimately, this is good for your business.
Insiders

Sign Up for our Newsletter

This site is protected by reCAPTCHA and the Google Privacy Policy and Terms of Service apply.

Trending Sources

article thumbnail

A Management Maturity Model for Performance

Alex Russell

your-ecommerce-site-is-not-an-spa] Inexperienced managers and engineers often blame this on the proliferation of third-party content. through one of the dozens of analytics tools they've inevitably integrated over the years), but nobody looks at it. When the speed of a device dominates, wealth correlates heavily with performance.

article thumbnail

Front-End Performance Checklist 2021

Smashing Magazine

This guide has been kindly supported by our friends at LogRocket , a service that combines frontend performance monitoring , session replay, and product analytics to help you build better customer experiences. Study common complaints coming into customer service and sales team, study analytics for high bounce rates and conversion drops.