Remove Analytics Remove Benchmarking Remove Data Remove Retail
article thumbnail

Data Mining Problems in Retail

Highly Scalable

Retail is one of the most important business domains for data science and data mining applications because of its prolific data and numerous optimization problems such as optimal prices, discounts, recommendations, and stock levels that can be solved using data analysis methods.

Retail 152
article thumbnail

Introducing Page Speed Benchmarks – a new resource for the performance community

Speed Curve

What are some good sites I can use for benchmarking? Page Speed Benchmarks is an interactive dashboard that lets you explore and compare web performance data for leading websites across several industries – from retail to media. Identify sites you can use for your own competitive benchmarking.

Insiders

Sign Up for our Newsletter

This site is protected by reCAPTCHA and the Google Privacy Policy and Terms of Service apply.

Trending Sources

article thumbnail

Five-nines availability: Always-on infrastructure delivers system availability during the holidays’ peak loads

Dynatrace

For retail organizations, peak traffic can be a mixed blessing. Five-nines availability: The ultimate benchmark of system availability. Cloud service providers, such as Amazon Web Services (AWS) , can offer infrastructure with five-nines availability by deploying in multiple availability zones and replicating data between regions.

article thumbnail

Why you need to know your site's performance poverty line (and how to find it)

Speed Curve

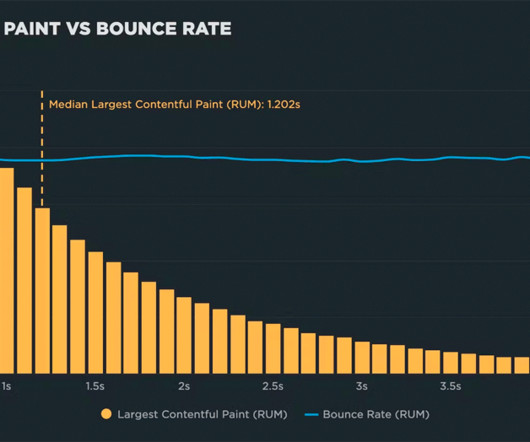
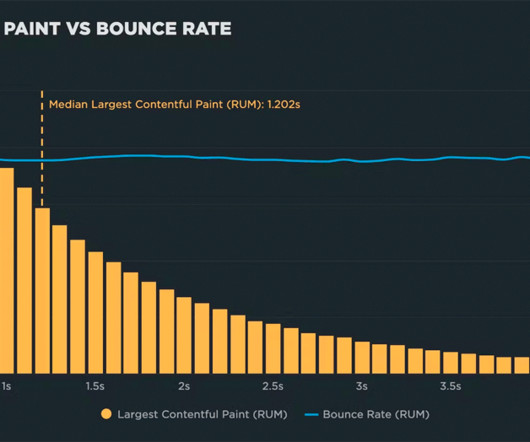
I coined this term more than ten years ago, when I was looking at data for a number of sites and noticed that – not only was there a correlation between performance metrics and business/engagement metrics – there was also a noticeable plateau in almost every correlation chart I looked at.

article thumbnail

An Opinionated Guide to Performance Budgets

Speed Curve

IMPORTANT: Before you overly invest in setting up performance budgets for any of these metrics, first take a good look at how these metrics align with your own data. The easiest way to do this is to look at rendering filmstrips in your synthetic test data. This is where you need to track your own real user data. Can I use it?

article thumbnail

Why you need to know your site's performance plateau (and how to find it)

Speed Curve

I first encountered it more than ten years ago, when I was looking at data for a number of sites and noticed that – not only was there a correlation between performance metrics and business/engagement metrics – there was also a noticeable plateau in almost every correlation chart I looked at.

article thumbnail

Google PageSpeed Insights - Scoring 100/100 with WordPress

KeyCDN

While these metrics can be very helpful it is also important to keep this data in perspective. Take these statistics from Google’s industry benchmarks for mobile page speed guide: We’ve said it before but it’s worth reiterating that as web page load times increase, so does the likelihood of your visitors.

Google 103