Remove Latency Remove Metrics Remove Operating System Remove Traffic
article thumbnail

Crucial Redis Monitoring Metrics You Must Watch

Scalegrid

You will need to know which monitoring metrics for Redis to watch and a tool to monitor these critical server metrics to ensure its health. Redis returns a big list of database metrics when you run the info command on the Redis shell. You can pick a smart selection of relevant metrics from these.

Metrics 130
article thumbnail

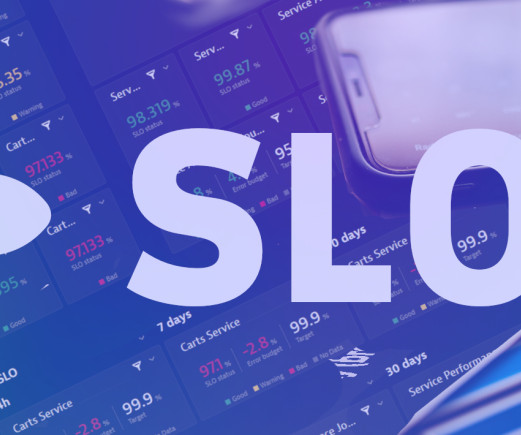
Lessons learned from enterprise service-level objective management

Dynatrace

Lastly, error budgets, as the difference between a current state and the target, represent the maximum amount of time a system can fail per the contractual agreement without repercussions. Organizations have multiple stakeholders and almost always have different teams that set up monitoring, operate systems, and develop new functionality.

Insiders

Sign Up for our Newsletter

This site is protected by reCAPTCHA and the Google Privacy Policy and Terms of Service apply.

Trending Sources

article thumbnail

How digital experience monitoring helps deliver business observability

Dynatrace

Fast, consistent application delivery creates a positive user experience that can ultimately drive customer loyalty and improve business metrics like conversion rate and user retention. It is proactive monitoring that simulates traffic with established test variables, including location, browser, network, and device type.

article thumbnail

Maximize user experience with out-of-the-box service-performance SLOs

Dynatrace

These signals ( latency, traffic, errors, and saturation ) provide a solid means of proactively monitoring operative systems via SLOs and tracking business success. While this connection might sound simple, finding the right metrics to measure the needed SLIs takes time and effort.

article thumbnail

The road to observability demo part 3: Collect, instrument, and analyze telemetry data automatically with Dynatrace

Dynatrace

Making applications observable—relying on metrics, logs, and traces to understand what software is doing and how it’s performing—has become increasingly important as workloads are shifting to multicloud environments. We also introduced our demo app and explained how to define the metrics and traces it uses.

Metrics 168
article thumbnail

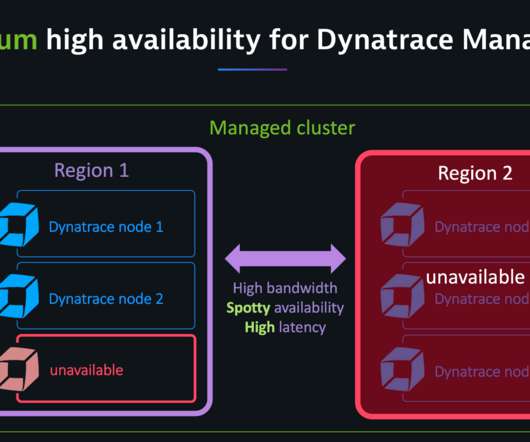
Dynatrace Managed turnkey Premium High Availability for globally distributed data centers (Early Adopter)

Dynatrace

Dynatrace Managed is intrinsically highly available as it stores three copies of all events, user sessions, and metrics across its cluster nodes. This means that Dynatrace continues full operation when a majority of nodes are up and a maximum of two nodes are down at a time. Minimized cross-data center network traffic.

article thumbnail

Answering Common Questions About Interpreting Page Speed Reports

Smashing Magazine

But do you know how Lighthouse calculates performance metrics like First Contentful Paint (FCP), Total Blocking Time (TBT), and Cumulative Layout Shift (CLS)? Still, there’s nothing in there to tell us about the data Lighthouse is using to evaluate metrics. But it comes with caveats. So why use lab data at all?

Speed 97