Remove Database Remove Java Remove Monitoring Remove Webinar
article thumbnail

What is a message queue? How an observability platform eases message queue monitoring

Dynatrace

TIBCO Enterprise Message Service features compatibility with software written in Java. The problem could be in the database, the HTTP connection, the configuration of the message, or an outage on the sending or receiving end. To learn more about automatic and intelligent observability, register for our on-demand webinar today.
Insiders

Sign Up for our Newsletter

This site is protected by reCAPTCHA and the Google Privacy Policy and Terms of Service apply.

Trending Sources

article thumbnail

A guide to Autonomous Performance Optimization

Dynatrace

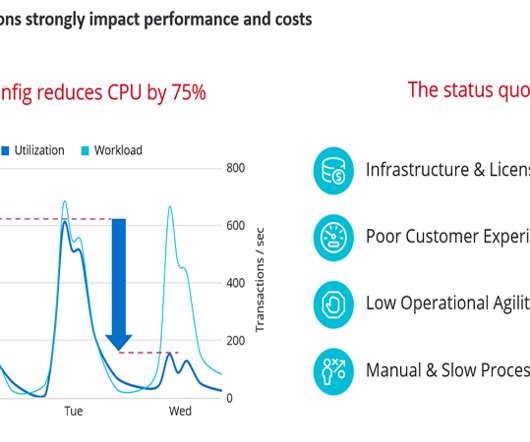
Stefano started his presentation by showing how much cost and performance optimization is possible when knowing how to properly configure your application runtimes, databases, or cloud environments: Correct configuration of JVM parameters can save up to 75% resource utilization while delivering same or better performance!

article thumbnail

What is Google Cloud Functions?

Dynatrace

GCF also enables teams to run custom-written code to connect multiple services in Node, Python, Go, Java,NET, Ruby, and PHP. These functions can connect with supported cloud databases, such as Cloud SQL and Bigtable. Observability and monitoring challenges with Google Cloud Functions. Watch webinar now! GCF use cases.

Google 224
article thumbnail

Azure Well-Architected Framework: What it is and how to tame it with AI and automation

Dynatrace

Most monitoring tools for migrations, development, and operations focus on collecting and aggregating the three pillars of observability— metrics, traces, and logs. Continuously monitor cost and optimize your capacity needs. Continuously monitor the application and the underlying infrastructure. Missing caching layers.

Azure 190
article thumbnail

What is? OpenTelemetry??An open-source standard for logs, metrics, and traces

Dynatrace

Monitoring begins here. To learn more about how to boost your multicloud observability with Dynatrace and OTel, join us for the on-demand webinar, How to include OpenTelemetry as part of your observability strategy today. Watch webinar now! These are core components and language-specific (such as Java, Python,Net, and so on).

article thumbnail

Sponsored Post: Software Buyers Council, InMemory.Net, Triplebyte, Etleap, Stream, Scalyr

High Scalability

Register for the webinar today. Upcoming topics include infrastructure and application monitoring, AI/ML platforms, and more. InMemory.Net provides a Dot Net native in memory database for analysing large amounts of data. Client libraries are available for Node, Ruby, Python, PHP, Go, Java and.NET. Learn more today.

Software 125