Remove 2015 Remove Architecture Remove Latency Remove Open Source
article thumbnail

Observability platform vs. observability tools

Dynatrace

Metrics are measures of critical system values, such as CPU utilization or average write latency to persistent storage. They are particularly important in distributed systems, such as microservices architectures. Observability platforms are becoming essential as the complexity of cloud-native architectures increases.

article thumbnail

USENIX SREcon APAC 2022: Computing Performance: What's on the Horizon

Brendan Gregg

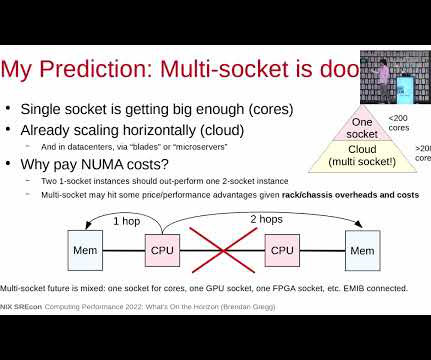
My personal opinion is that I don't see a widespread need for more capacity given horizontal scaling and servers that can already exceed 1 Tbyte of DRAM; bandwidth is also helpful, but I'd be concerned about the increased latency for adding a hop to more memory. Ford, et al., “TCP

Insiders

Sign Up for our Newsletter

This site is protected by reCAPTCHA and the Google Privacy Policy and Terms of Service apply.

Trending Sources

article thumbnail

How To Add eBPF Observability To Your Product

Brendan Gregg

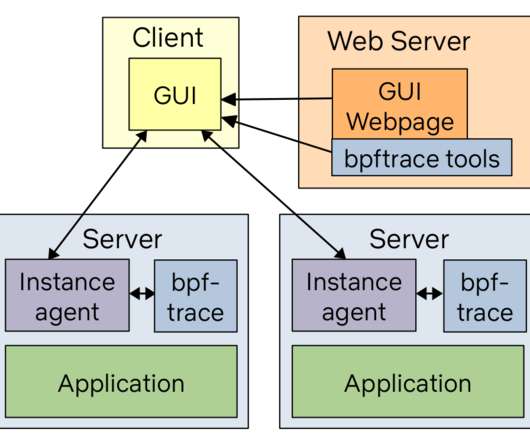
opensnoop Files opened table. biolatency Disk I/O latency histogram heat map. runqlat CPU scheduler latency heat map. The architecture is: While the bpftrace binary is installed on all the target systems, the bpftrace tools (text files) live on a web server and are pushed out when needed.

Latency 145
article thumbnail

USENIX SREcon APAC 2022: Computing Performance: What's on the Horizon

Brendan Gregg

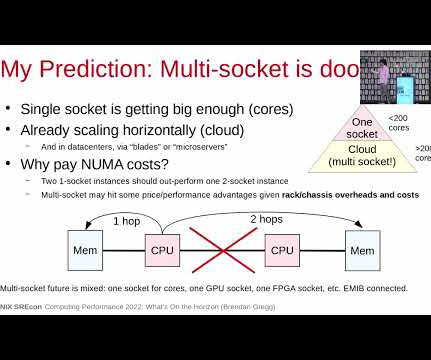
My personal opinion is that I don't see a widespread need for more capacity given horizontal scaling and servers that can already exceed 1 Tbyte of DRAM; bandwidth is also helpful, but I'd be concerned about the increased latency for adding a hop to more memory. Ford, et al., “TCP

article thumbnail

How To Add eBPF Observability To Your Product

Brendan Gregg

If you're using an open source monitoring platform, first check if it already has a BPF agent. opensnoop Files opened table 3. biolatency Disk I/O latency histogram heat map 5. runqlat CPU scheduler latency heat map 10. Think of this as "version 1": A starting point that's pretty useful.

article thumbnail

Front-End Performance Checklist 2020 [PDF, Apple Pages, MS Word]

Smashing Magazine

dashboard (open source), SpeedCurve and Calibre are just a few of them, and you can find more tools on perf.rocks. Estimated Input Latency tells us if we are hitting that threshold, and ideally, it should be below 50ms. Large preview ). There are many tools allowing you to achieve that: SiteSpeed.io

article thumbnail

Front-End Performance Checklist 2021

Smashing Magazine

Defining The Environment Choosing a framework, baseline performance cost, Webpack, dependencies, CDN, front-end architecture, CSR, SSR, CSR + SSR, static rendering, prerendering, PRPL pattern. dashboard (open source), SpeedCurve and Calibre are just a few of them, and you can find more tools on perf.rocks. Large preview ).