

Using Prometheus and Grafana to monitor a Nutanix Cluster.
n0derunner
MAY 17, 2024
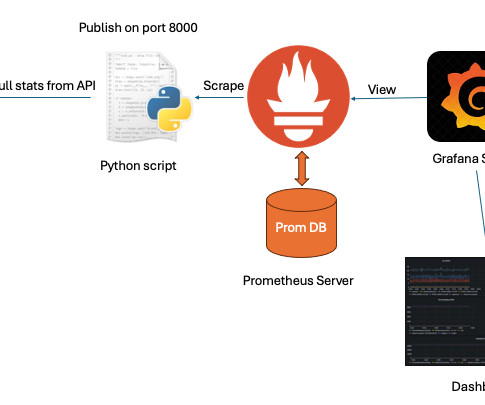
Using a small python script we can liberate data from the “Analysis” page of prism element and send it to prometheus, where we can combine cluster metrics with other data and view them all on some nice Grafana dashboards. appeared first on n0derunner.


Let's personalize your content