Continuous performance with guardrails and breadcrumbs


The hardest part about web performance isn’t making your site faster – it’s keeping it that fast. Hearing about a company that devoted significant effort into optimizing their site, only to find their performance right back where it started a few months later, is all too familiar.
The reality is that, as critical as site speed is, it’s also very easy to overlook. It doesn’t jump out like a blurry image or a layout issue. And the majority of modern tools and frameworks that are used to build sites today make it all too easy to compound the issue.
Making performance more visible throughout the development process is one of the most critical things a company can do.
I like to think of it as setting up guardrails and breadcrumbs.
- We need guardrails to help protect us from shipping code that will result in unexpected regressions.
- We need breadcrumbs that we can follow back to the source to help us identify why a metric may have changed.
Guardrails and breadcrumbs need to work together. Setting up guardrails without the ability to dive in more will lead to frustration. Having proper breadcrumbs without guardrails in place all but assures we will constantly be fighting regressions after they’ve already wreaked havoc on our sites and our users.
Let’s take a look at both of these concepts and how they should work together.
Guardrails
The default stance of most tooling today is to make it easier to add code to your site or application at a moment’s notice. (Hey there, npm install.) What they don’t prioritize nearly as much is making you aware that you’re doing something that’s going to negatively impact your performance.
To combat that, we need to find ways to put guardrails into our workflows to help us notice when we're at risk of causing a performance regression. Luckily we have a few tools at our disposal.
Performance budgets
Tammy has written quite a bit about performance budgets, and it’s something worth repeating. While a budget alone doesn’t ensure good performance, I have yet to see a company sustain performance over the long haul without using some sort of performance budget (whether they use that term or not).
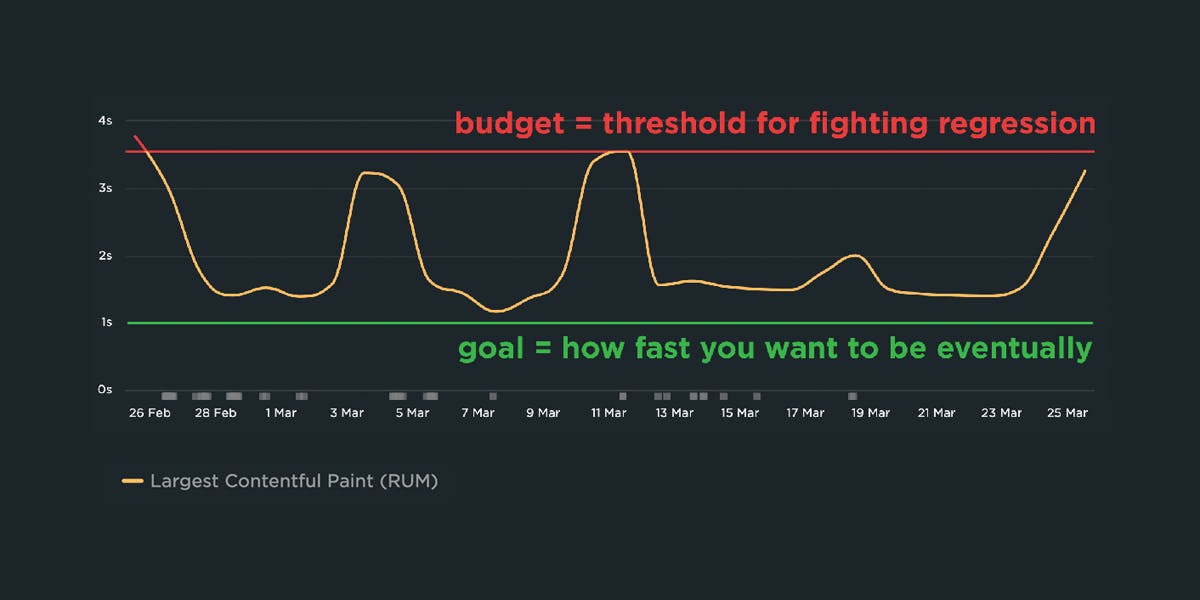
I like to define a performance budget as a clearly defined limit on one or more performance metrics that the team agrees not to exceed. That budget then is used to alert on potential regressions, break deployments when a regression is detected, and guide design and development decisions.
SpeedCurve comes with some default performance budgets, but you’ll want to reassess for yourself, probably on a 2-4 week basis to make sure the budgets you have set align with your reality. We’re looking for a balance of "alerts if there's a regression" and "doesn’t alert so much that we start ignoring the alerts".
Here's an example from a recent KickStart engagement. (KickStarts are consulting projects where we help companies get set up and running with their monitoring.) The budget for JS Scripting was set to 2000ms (that’s the red line), but the site was well below budget. The budget was useless. They would have to have a regression of over 500% to trigger any sort of alert!
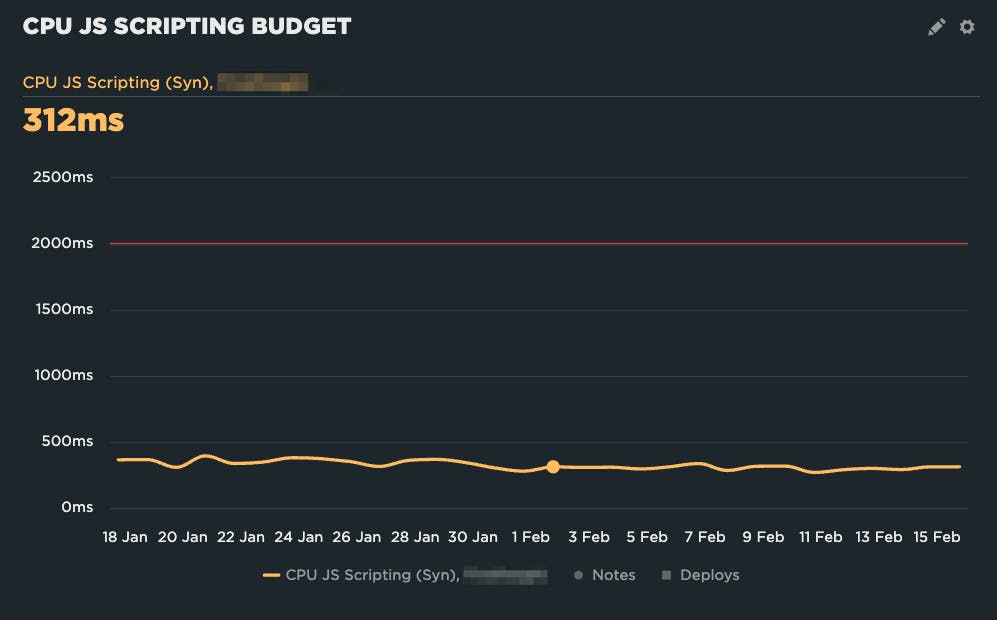
We ended up setting the budget at 375ms based on the last two weeks of data at the time. That enables us to get alerted on regressions without getting alert fatigue.
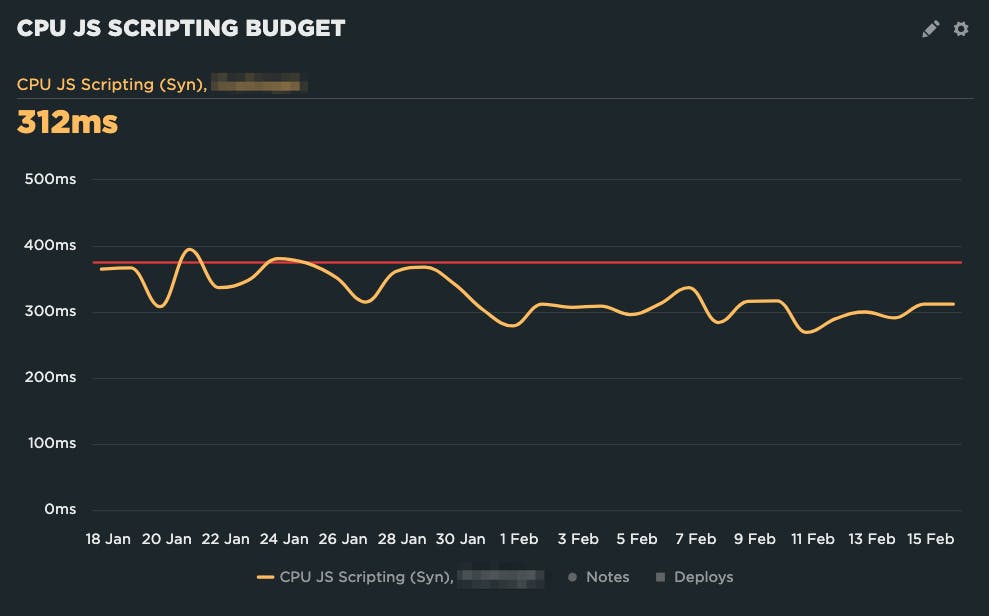
Looking at the chart, if they continue on the current trend, the next time they reassess their budget they may want to bring it down a little bit further, as some recent changes seem to have resulted in improvements.
On the other hand, their Start Render budget was too aggressive. They were constantly over, resulting in notification fatigue – it was always over, so why pay attention?
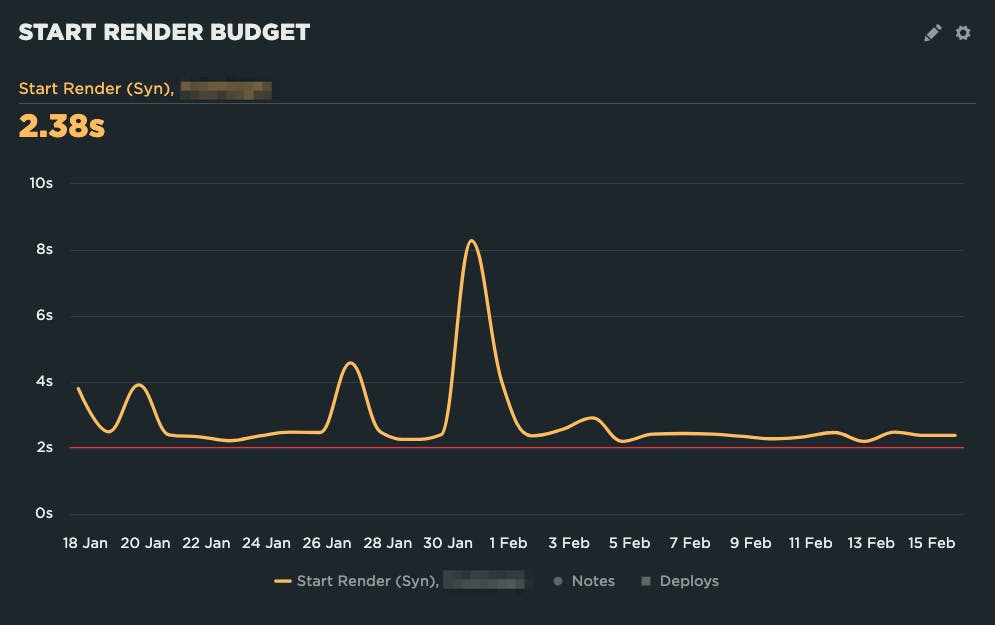
Adjusting the budget to 3 seconds makes it much more actionable.
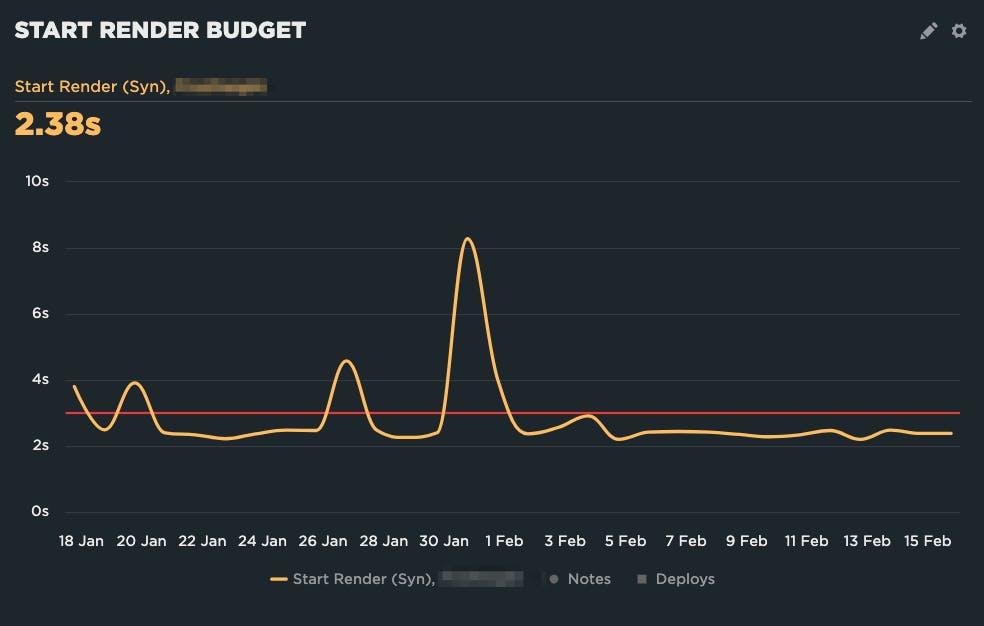
Now they will only get emailed when the budget is triggered by a regression, so they know it's something they should take action on.
Automated testing of code changes
Another important guardrail is to have automated performance testing when code changes occur. Just as important, those test results should show up somewhere in the development process – where the developers are. Requiring the team to go looking for results in another tool every time adds unnecessary friction.
A great way to do this is to have an automated test triggered with every pull request, and then have the results put right back into the details of the pull request for easy review.
I’m a big fan of the Github integration for this reason. With zero code changes (just a few button clicks to get GitHub and SpeedCurve talking to each other), you can get automated performance testing set up on every pull request. (If you’re not using GitHub, you can also use the deploy API to trigger automated tests.)
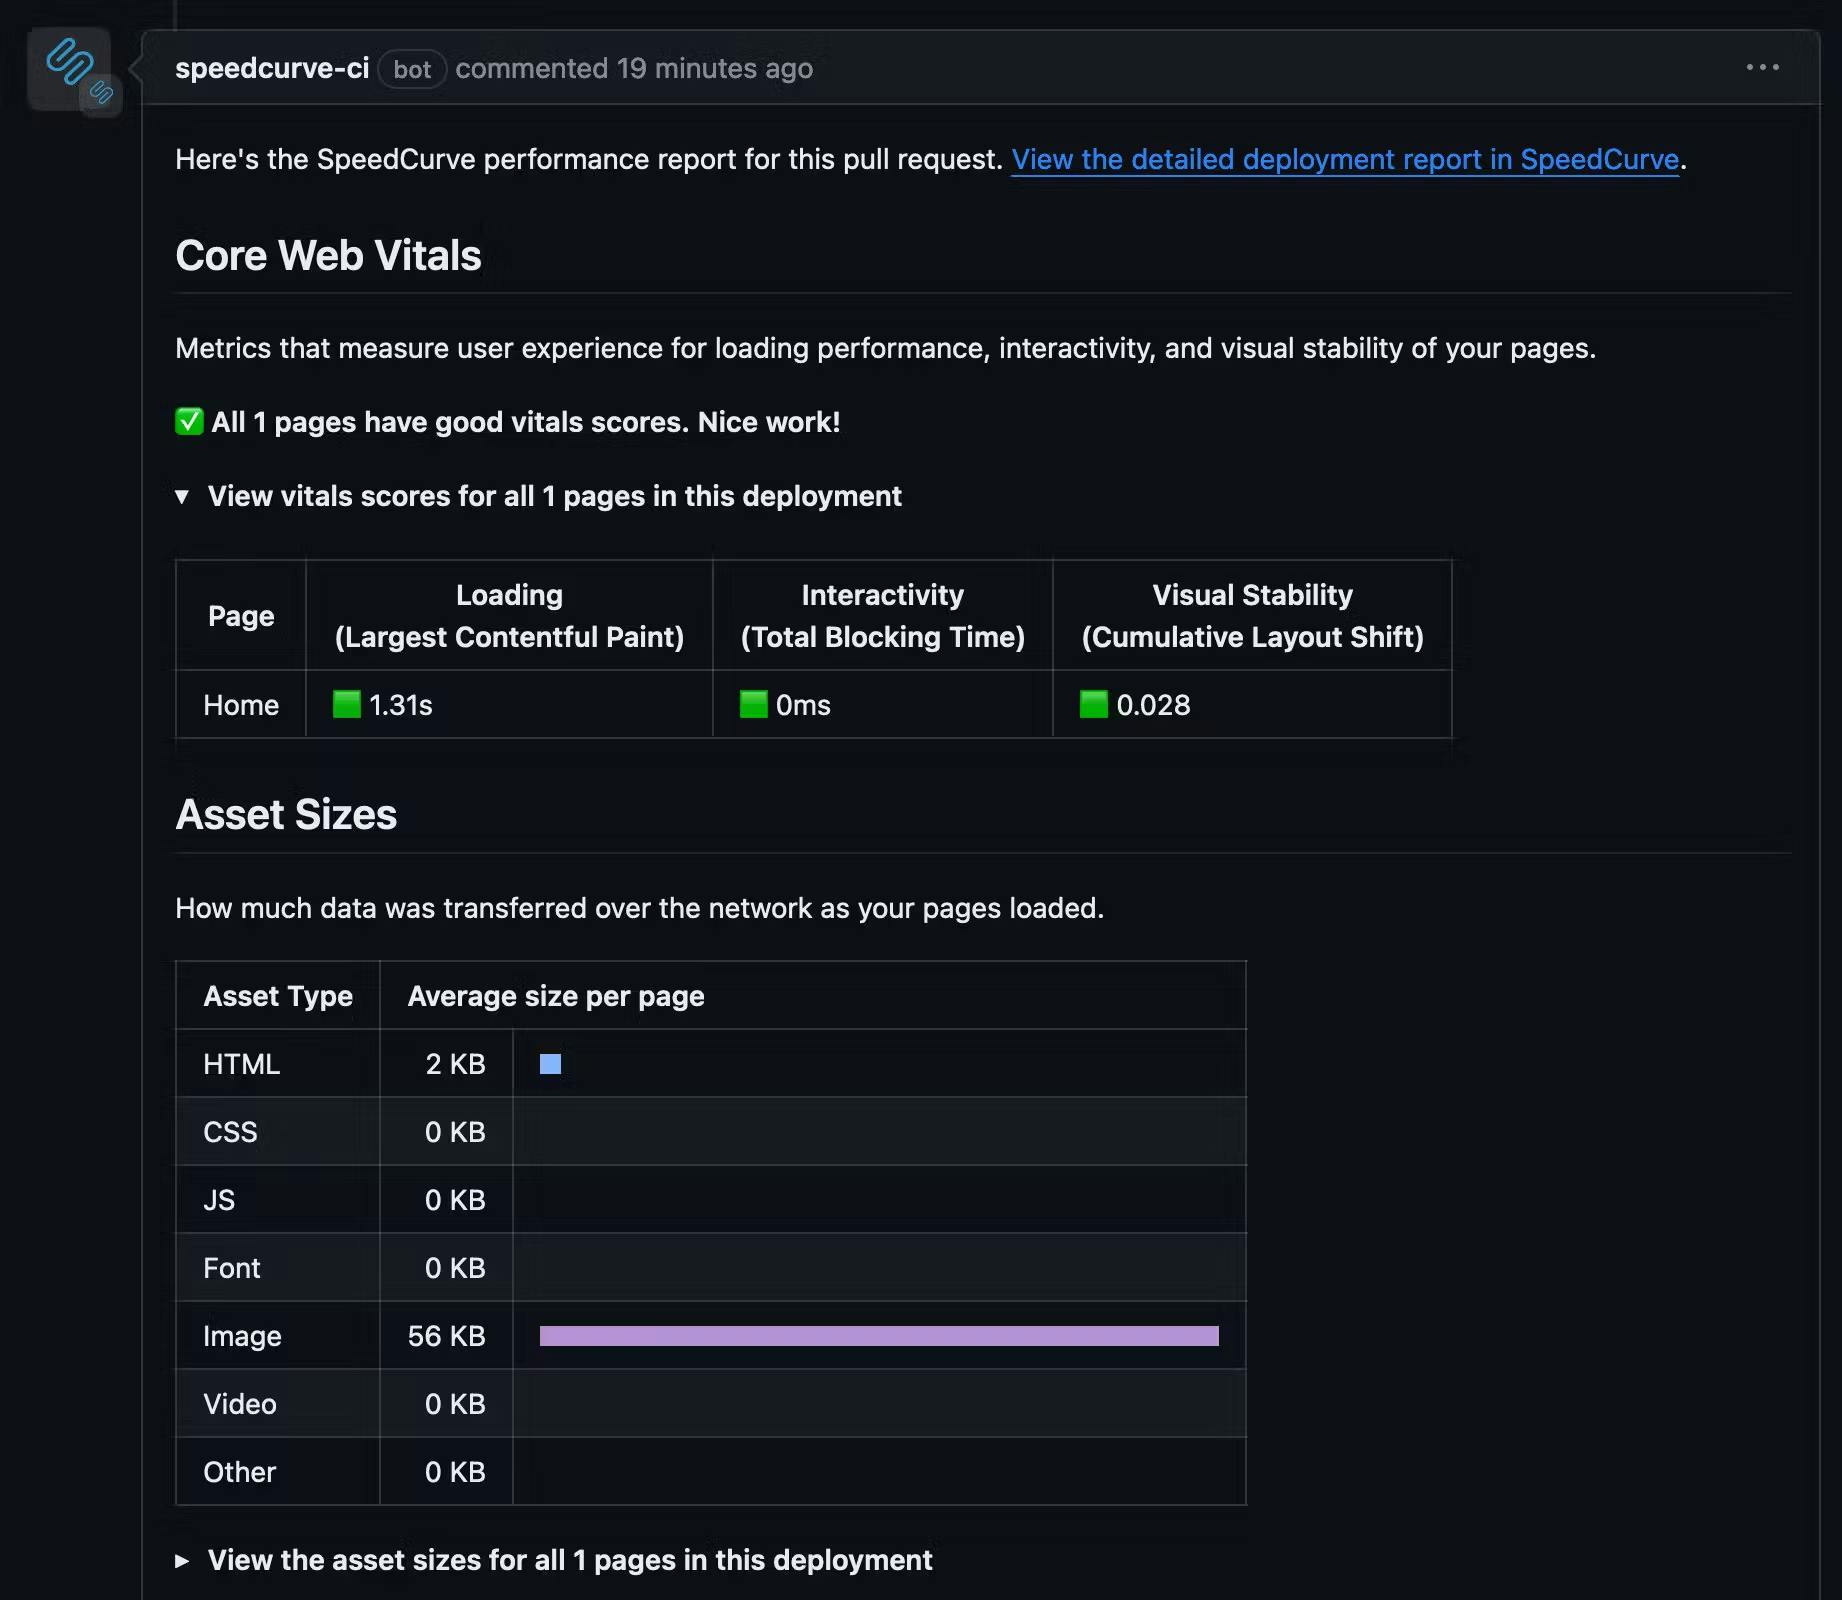
Now when a team makes a code change, they get immediate performance feedback right in the pull request review process, helping performance stay front of mind.
Breadcrumbs
Guardrails are awesome and important for helping catch regressions before they occur, but they’re only half the battle. If we can see that we’re suffering from – or about to suffer from – a regression, but we can’t figure out why, we’ll quickly become frustrated... and may even lose faith in the tools and processes we're using.
We need to leave ourselves breadcrumbs – a path back to identifying the actual source of a regression so we can fix things.
Deployment tracking
If you’re using the GitHub integration, you get a breadcrumb by default. When the integration comments on the pull request, you’re given a link back to the deployment report. (You also get the report when you use the Deploy API, minus the Github specific information.)
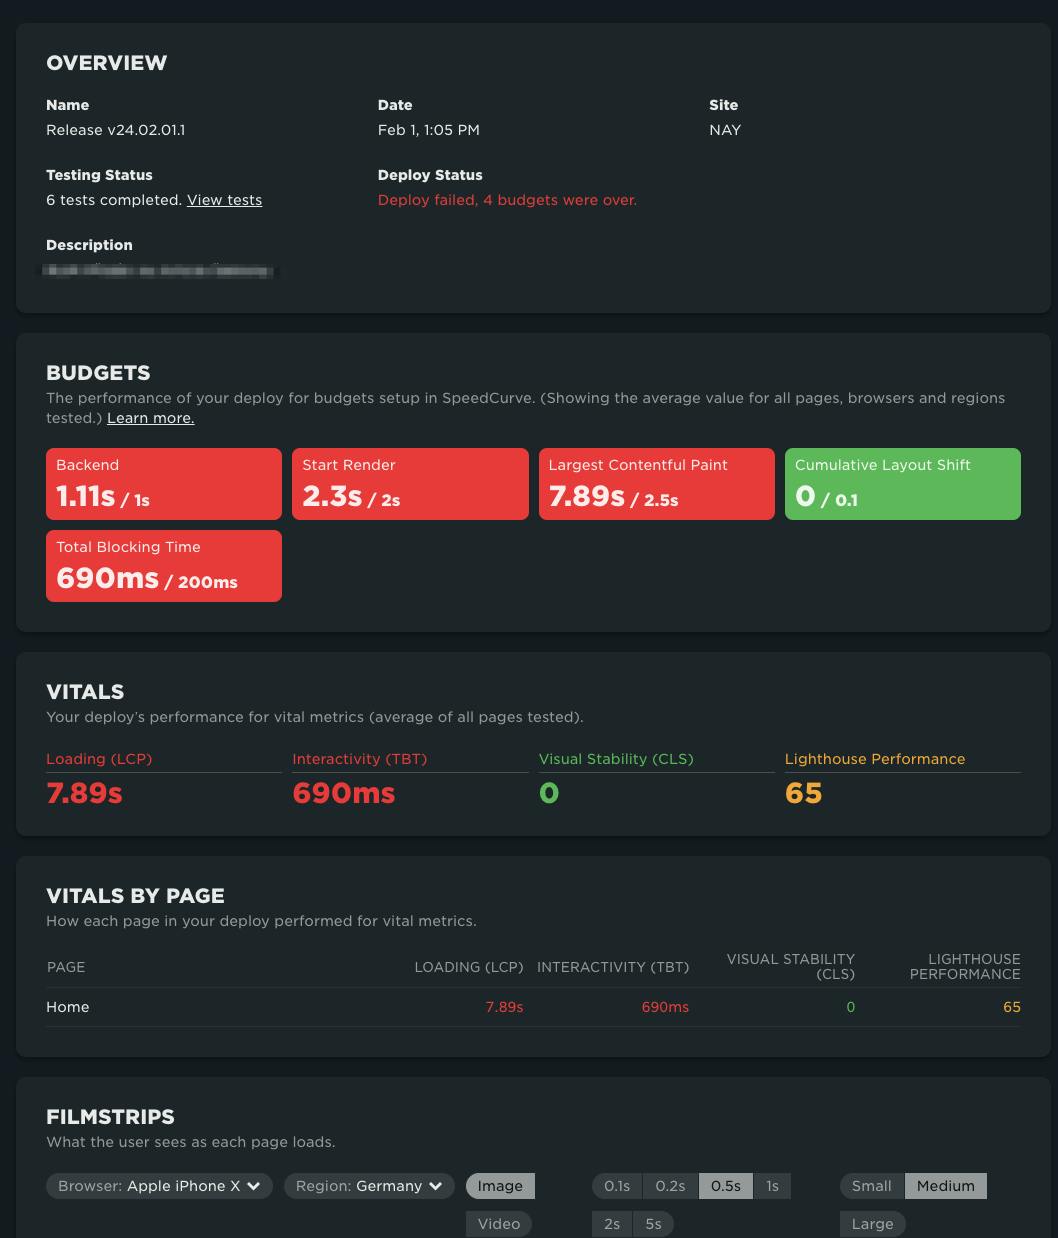
The deployment report lets you see:
- The associated code repository and pull request (when using the GitHub integration)
- The code branch
- The commit ID
- The test results
- The status of any budgets for that test and whether or not the test failed or passed
- Full, comprehensive test results, so you can dig in further
Don’t overlook the importance of that last one! Having automated testing that provides a basic overview report with no way to really dig in is a fast track to frustration.
Notes
Deployment tracking automatically adds notes to your charts, so you can quickly spot what changed, and when.
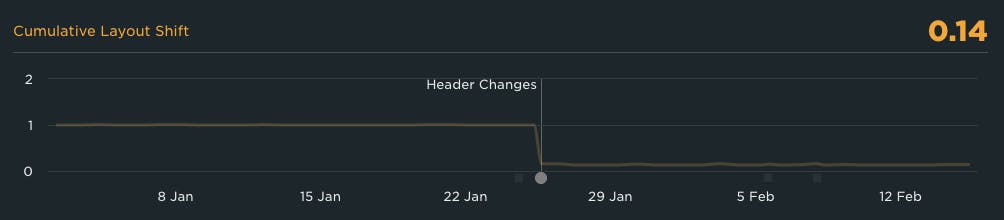
You can also manually add notes for situations where a deployment wasn’t the cause of the change. For example, if you’ve made changes to your CDN configuration, or a third-party provider had an outage.
Notes don’t clutter the charts (they show up as little icons below each chart and only bring up more detail when hovered over), so you can – and probably should – use them liberally to help you remember why you may be seeing a shift in metrics at a particular point in time. Again, think of these as little breadcrumbs you’re leaving for you and your teammates to be able to quickly identify the source of changes in the future.
For deployments, you’ll also be able to click on the notes to be taken back to the deployment details page and dive right back in.
Guardrails and breadcrumbs
Performance isn’t something we fix once and then walk away from. As the content and composition of our pages change, we need to make performance a continuous focus.
Guardrails and breadcrumbs work together to help us get a comprehensive picture of what's happening.
- Performance budgets let us set thresholds, with alerting, on key metrics so we know right away if there's a problem
- Automated code testing puts performance information right in front of the developers, using those same performance budgets to give a clear indication of the impact of every code change
- Pairing automated testing with detailed test results ensure that developers are able to dive in and quickly identify the source of the regression
- Having annotations appear in historical charting that connects to those deployments – as well as other changes – ensures the entire team has full context in why performance may have shifted
Putting up the appropriate guardrails to protect ourselves from regressions – then pairing that with a trail of breadcrumbs so that we can dive in and quickly identify what the source is when a regression occurs – are essential steps to ensure that when we make our sites fast, they stay that way.

Read Next
If you're not already using performance budgets to prevent regressions, you should be! Here's how to get started.

Learn how to use our GitHub integration to fight regressions and keep your pages fast.