NEW: On-demand testing in SpeedCurve!


Image by Freepik
On-demand testing has sparked a lot of discussion here at SpeedCurve over the past year. You've always had the ability to manually trigger a round of tests – based on the scheduled tests in your settings – using the 'Test Now' button. But there hasn't been a lot of flexibility to support nuanced use cases, such as...
"I just deployed changes to my site and want to check for any regressions."
"I saw a change to my RUM data and I want to see if I can replicate it with synthetic for further diagnostics."
"I have a paused site that I don't want to test regularly, but would like to test from time to time."
"Please just let me test any URL I want without setting up a site and scheduling testing."
"I need to quickly debug this script without kicking off tests for my entire site."
"I would like to get a first look at a page in order to troubleshoot regressions I saw in RUM."
Based on your feedback, we've just launched new capabilities for on-demand testing. We're pretty excited about these, and we hope you will be, too!
In this post, we'll:
- Highlight the differences between on-demand and scheduled testing
- Cover the various types of on-demand testing, including some of the more common use cases we've heard from SpeedCurve users
- Step you through running an on-demand test
Let's goooooooo!
What are the two types of tests within SpeedCurve?
Synthetic performance testing comes in two forms:
Scheduled testing
Baselining. Benchmarking. Continuous performance testing. Tried-and-true performance monitoring goes by many names. This is a necessary offering that keeps folks honest, supports the use of performance budgets, and gives you a lot of consistency when identifying what has changed over time or between deploys.
On-demand testing
This is something our new release fully embraced. Based on feedback from our customers – as well as the industry at large – we now give you the ability to run tests when debugging, benchmarking, or just because you feel like it. This is a highly sought after arrow in your web performance quiver.
On-demand testing in SpeedCurve
You now have two options for testing on demand:
Site testing
For each site you have configured in your SpeedCurve test settings, you have the ability to test on demand. Using this option, you'll test the existing URLs you have configured for a Site using the pre-defined configuration in your settings.
Custom URL testing
You now have the ability to test any URL using selected browsers and locations. You can also script a test if you are testing something using any of the scripting options, such as blocking third parties or testing a page within a multi-step transaction.
How do I run tests on demand?
You can trigger on-demand tests either automatically or manually, using the options described below.
Automatic: API, CLI, GitHub integration
On-demand testing of a site can be triggered using these options:
- SpeedCurve REST API
- SpeedCurve CLI
- SpeedCurve Github integration – NEW! This is a great option for CI/CD or other means of triggering non-scheduled tests.
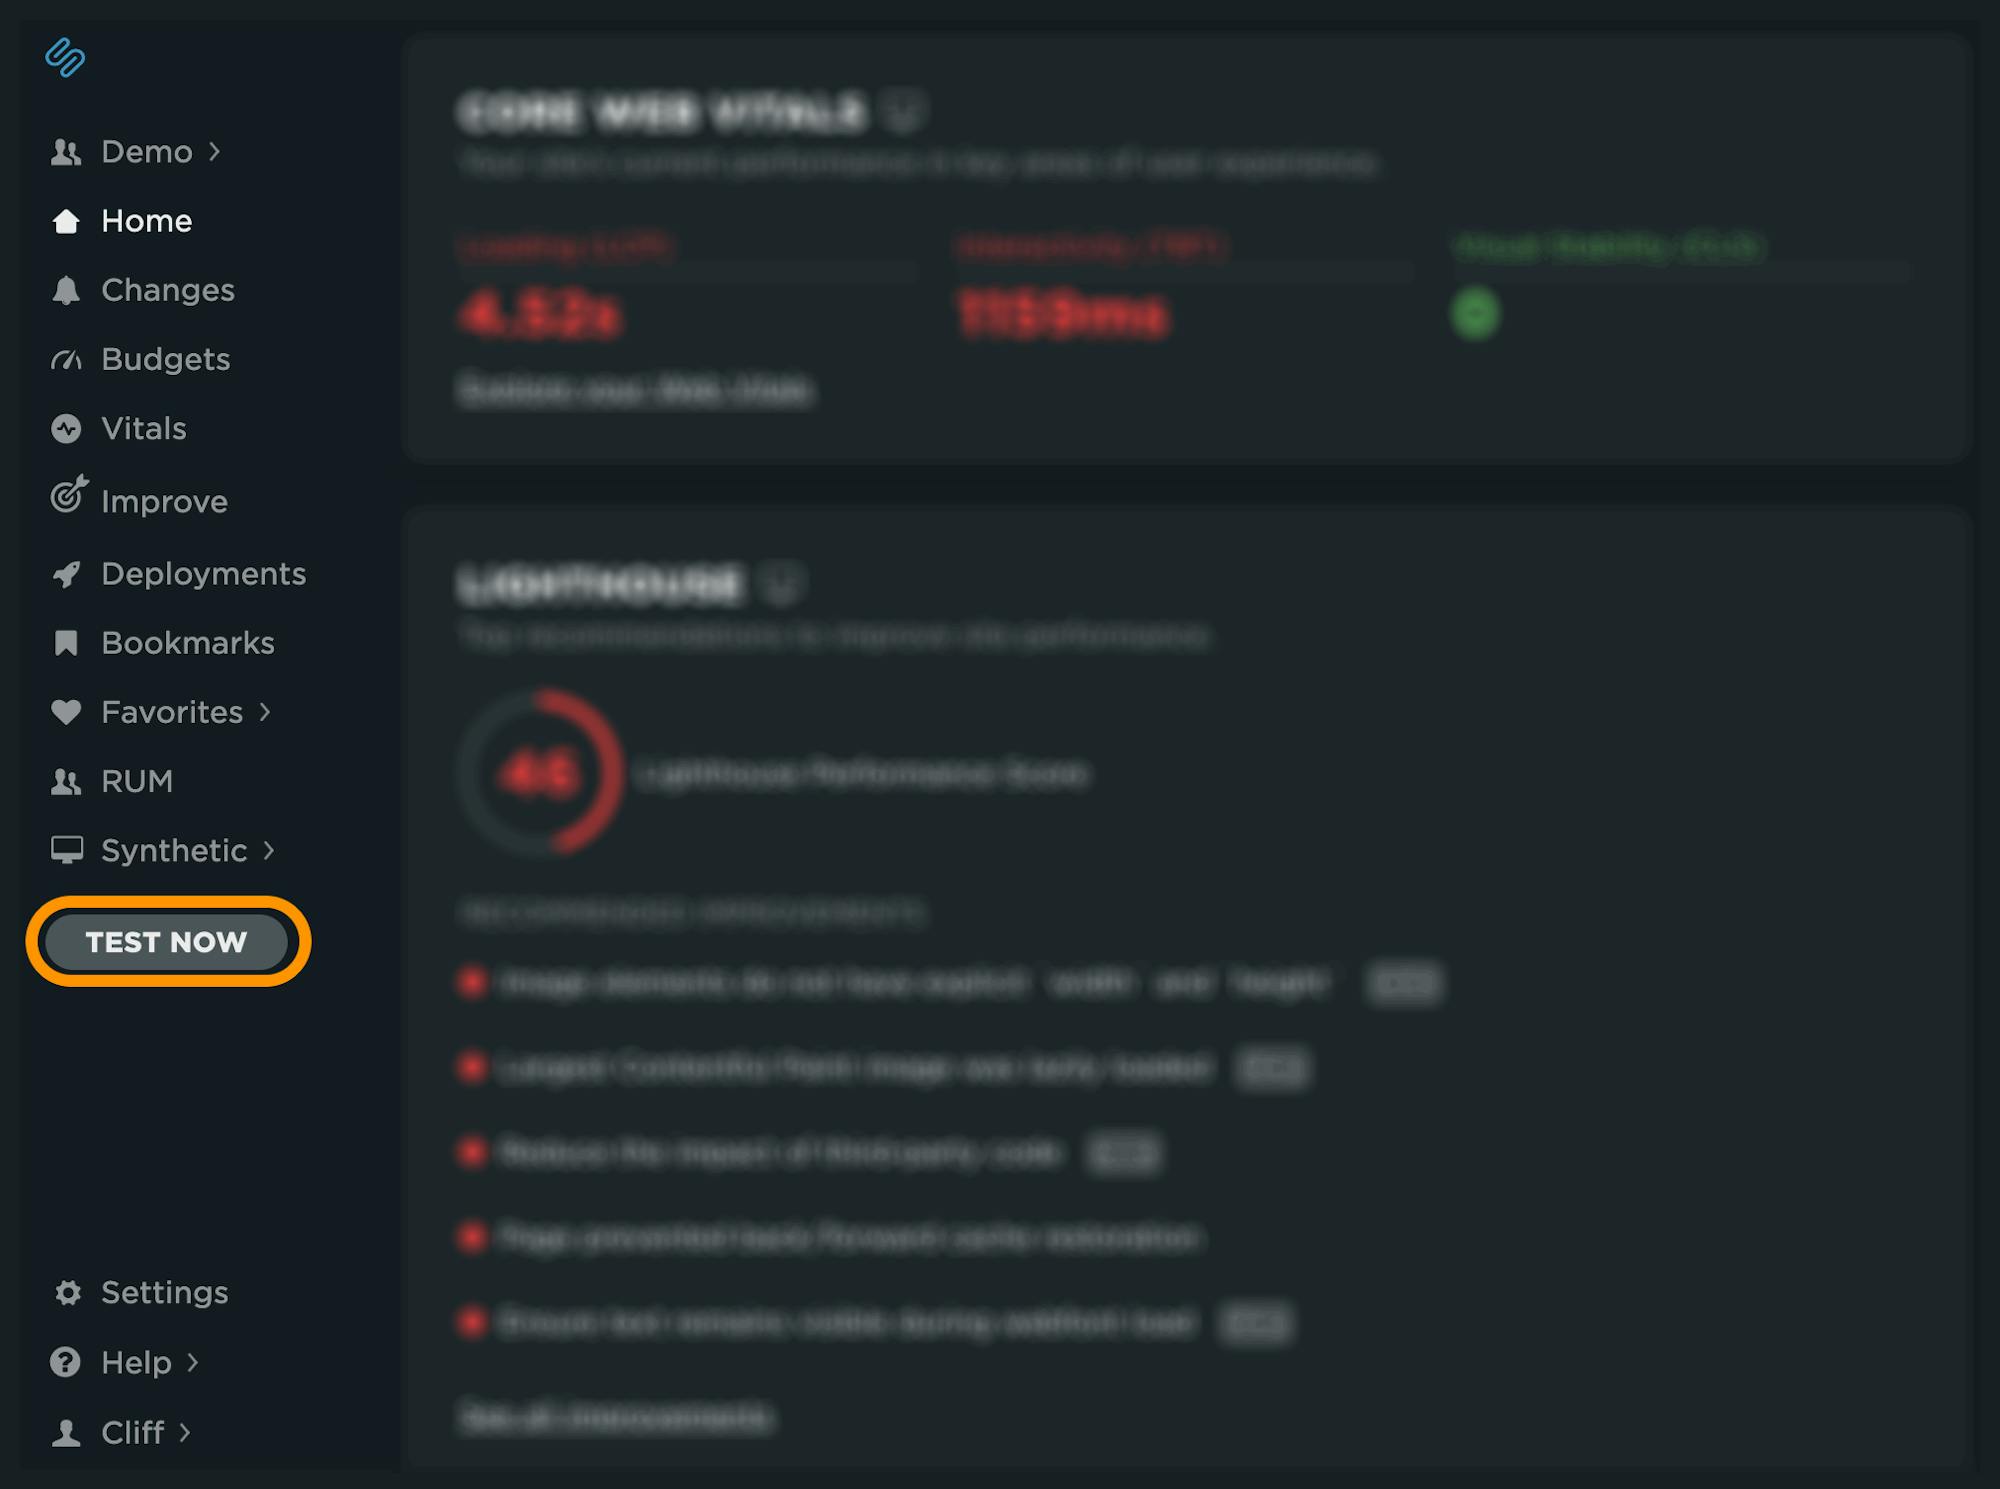
Manual: 'Test Now'
We've added new options to the 'Test Now' feature in SpeedCurve. To run an on-demand test, simply click on 'Test Now' from the side menu.
Support article: Trigger deployment tests
On-demand site testing
Here are some common use cases that may sound familiar to you:
"I just deployed changes to my site and want to check for any regressions."
"I saw a change to my RUM data and I want to see if I can replicate it with synthetic for further diagnostics."
"I have a paused site that I don't want to test regularly, but would like to test from time to time."
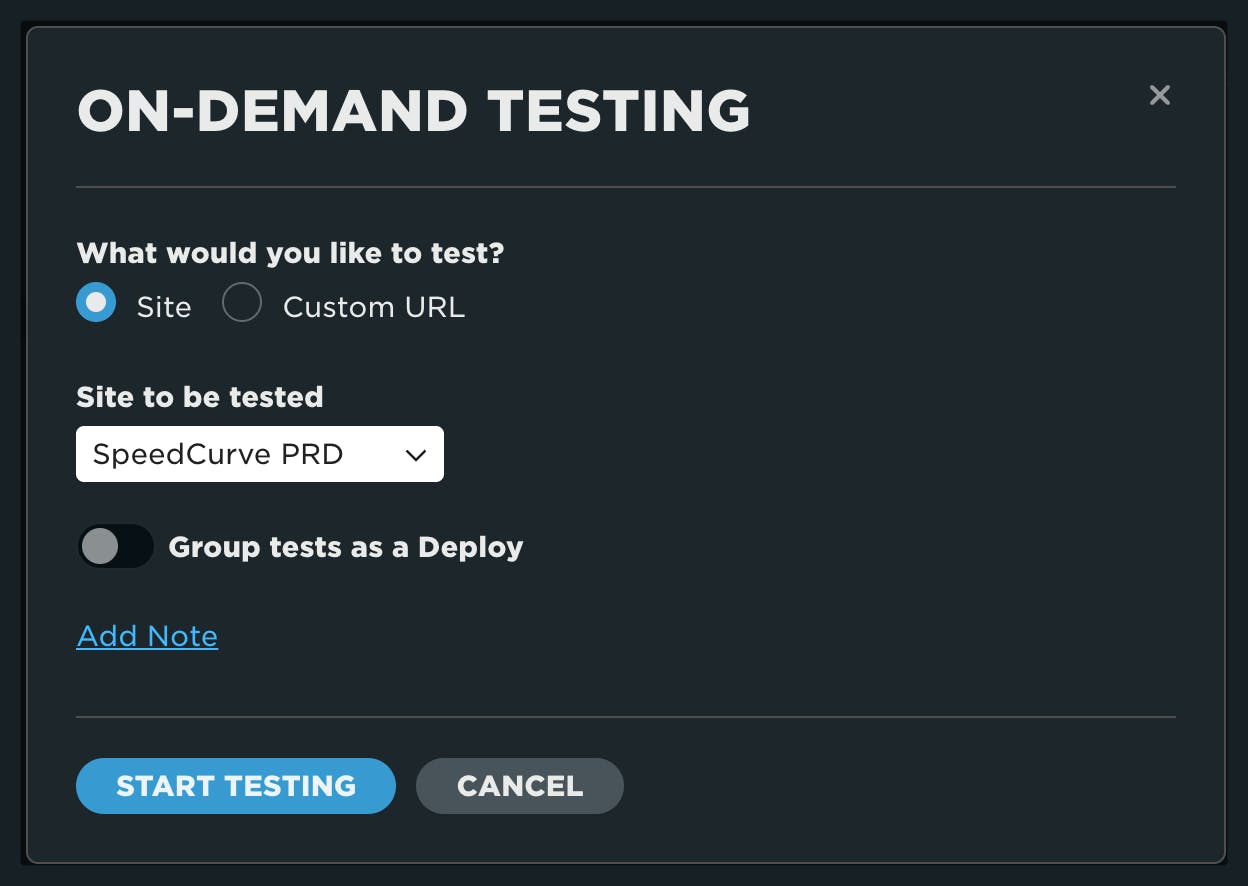
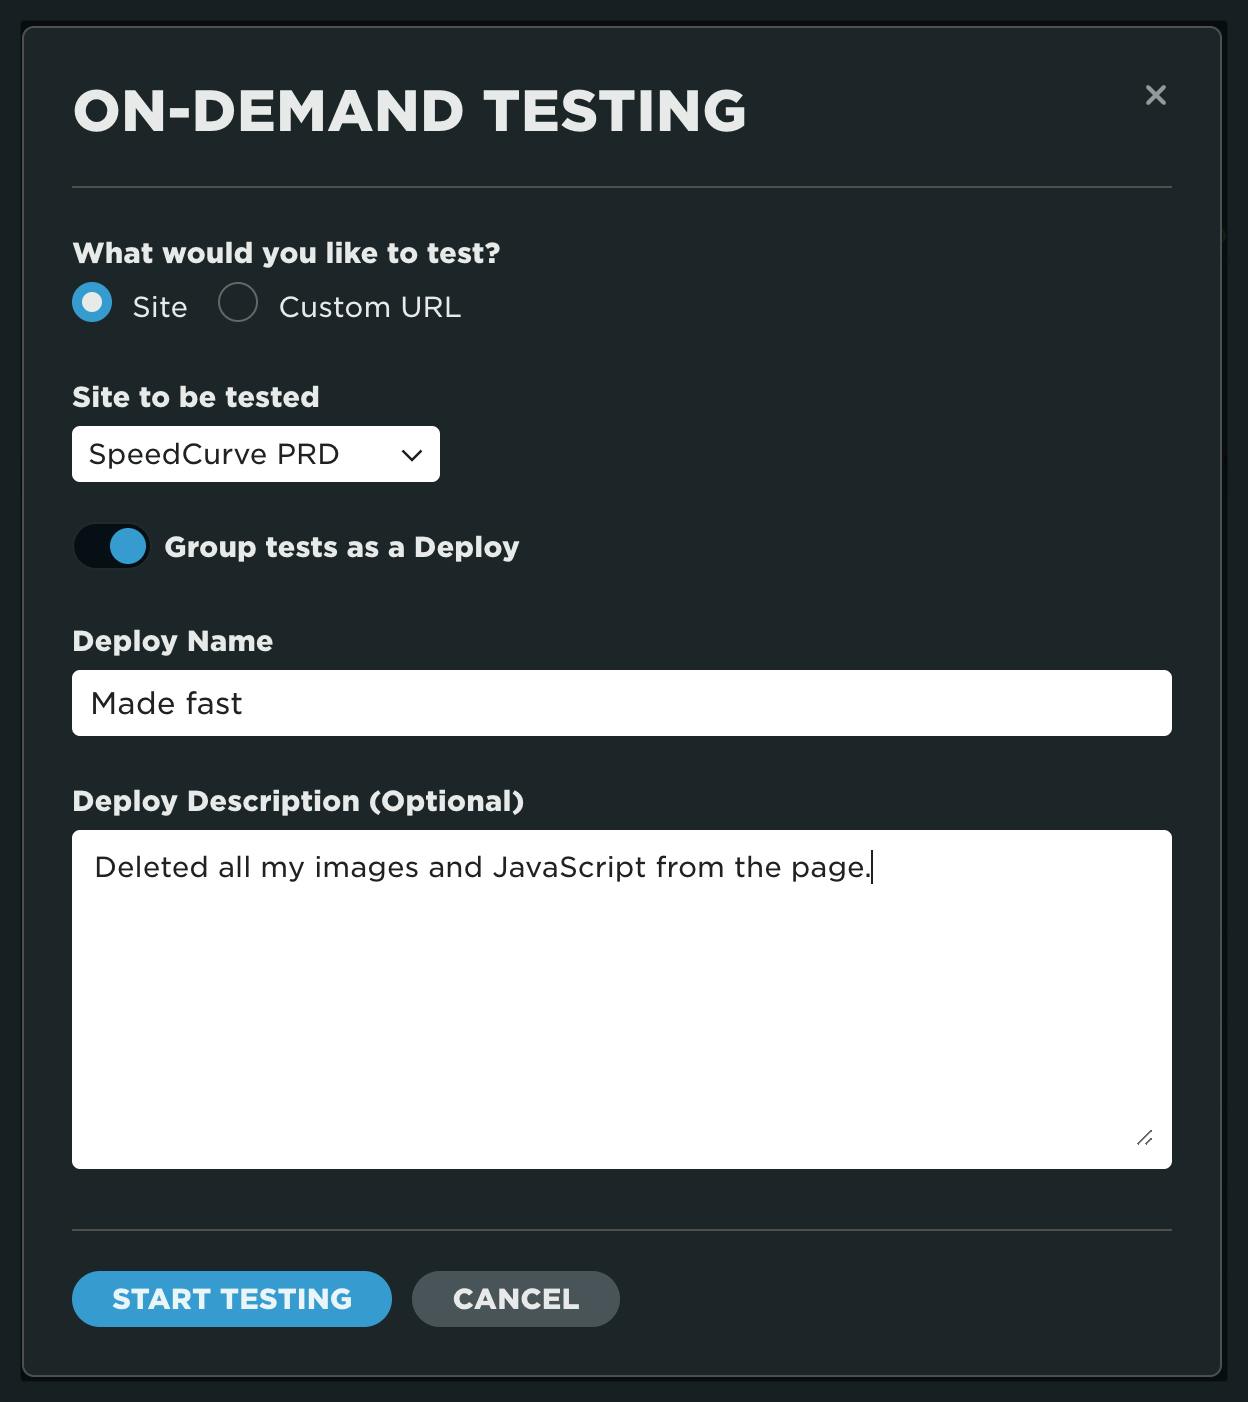
To test an existing site, select the site (or sites) to be tested. You can optionally add a note here, or elect to group the tests as a deployment. (I'll discuss that later in this post.)
Support article: Test a site on demand
Custom URL (adhoc) testing
Some of these use cases may be familiar to you as well:
"Please just let me test any URL I want without setting up a site and scheduling testing."
"I need to quickly debug this script without kicking off tests for my entire site."
"I would like to get a first look at a page in order to troubleshoot regressions I saw in RUM."
There are many reasons you may want to execute an adhoc test in SpeedCurve. The custom URL option when selecting 'Test Now' allows you to do just that.
To test a custom URL, click the 'Test Now' button and select the custom URL in the dialog. You have the option to add one or more URLs for testing, as well as the ability to select different regions, browser types, and the number of times to test the URL.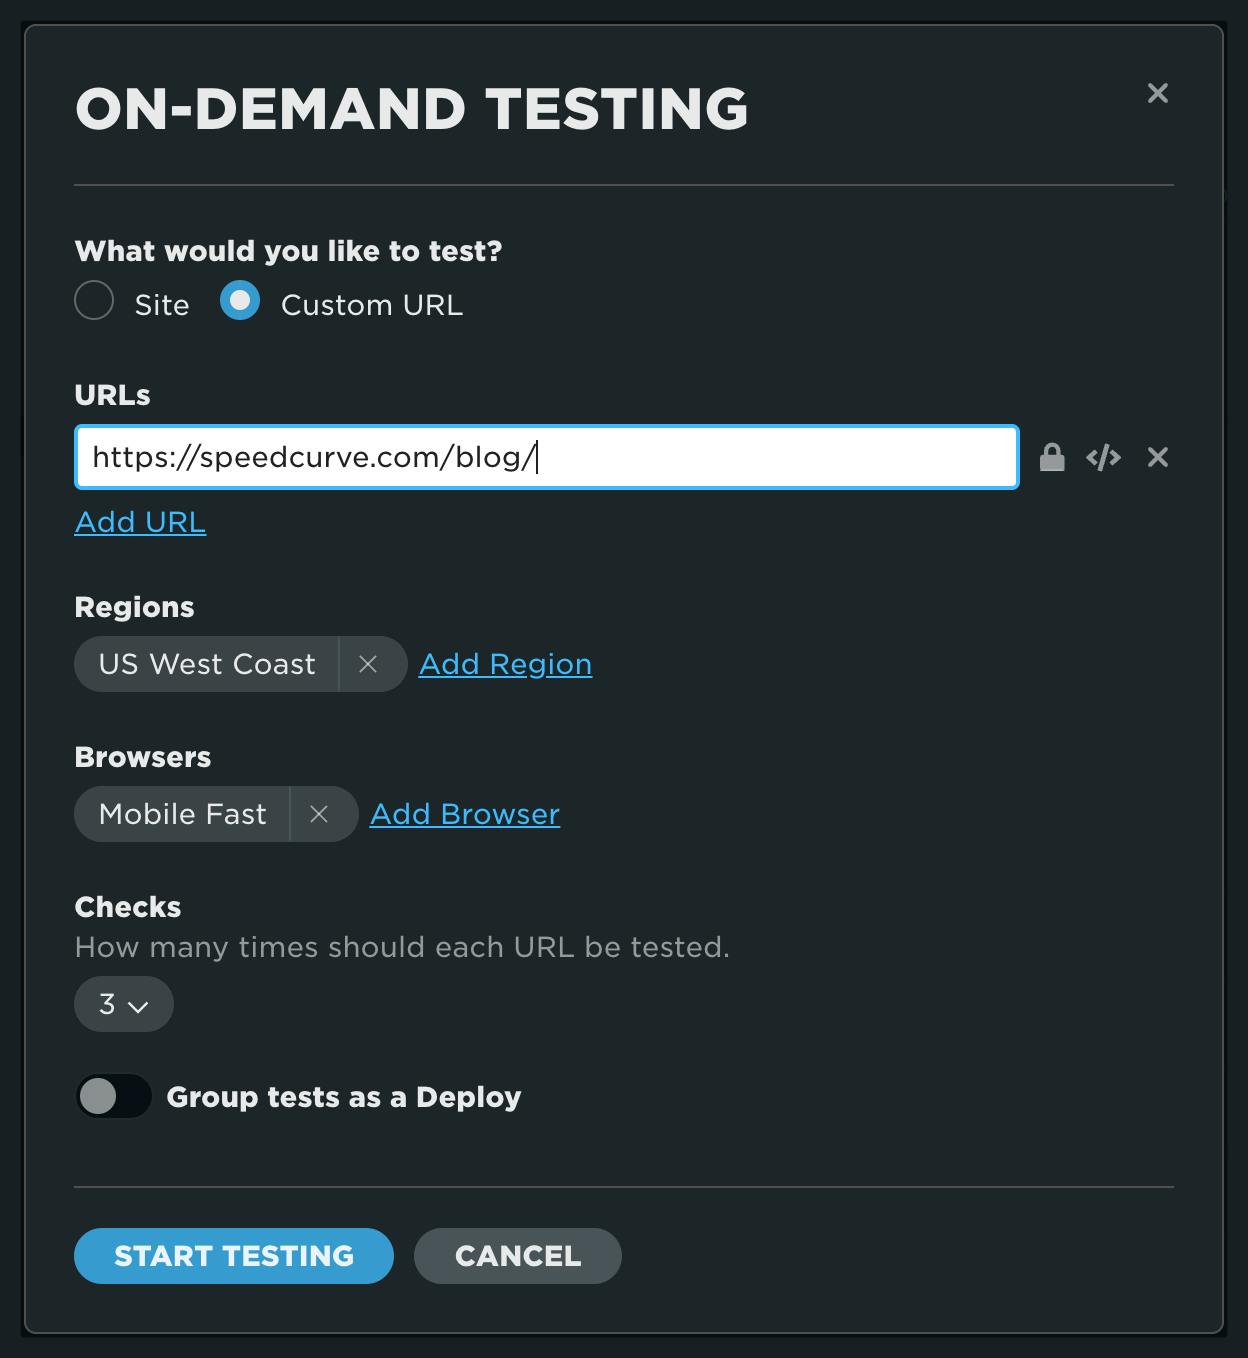
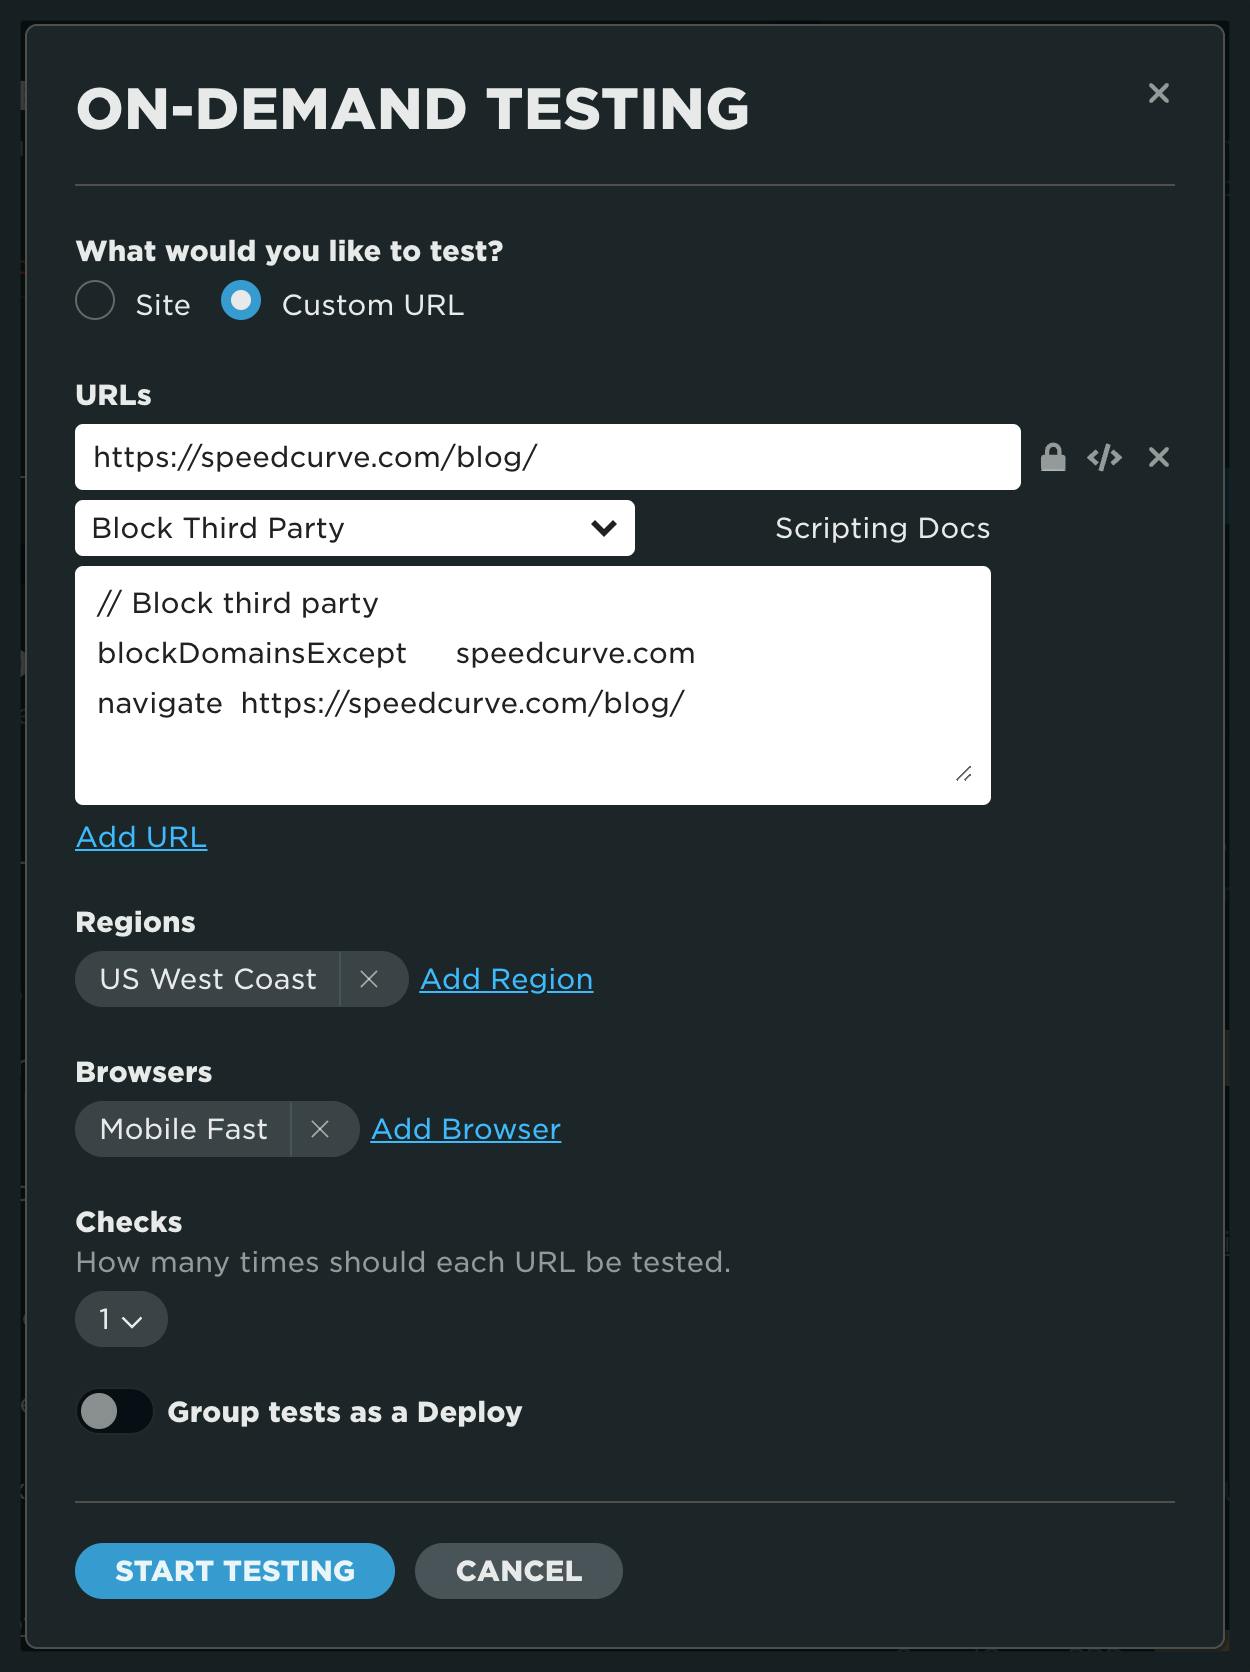
You also have the option to add basic authentication, as well as a scripted test. This can be very useful if you are trying to debug a script before adding it to a site, or if you simply need advanced options for the site or user flow you are testing.
Support article: Adhoc (custom URL) testing
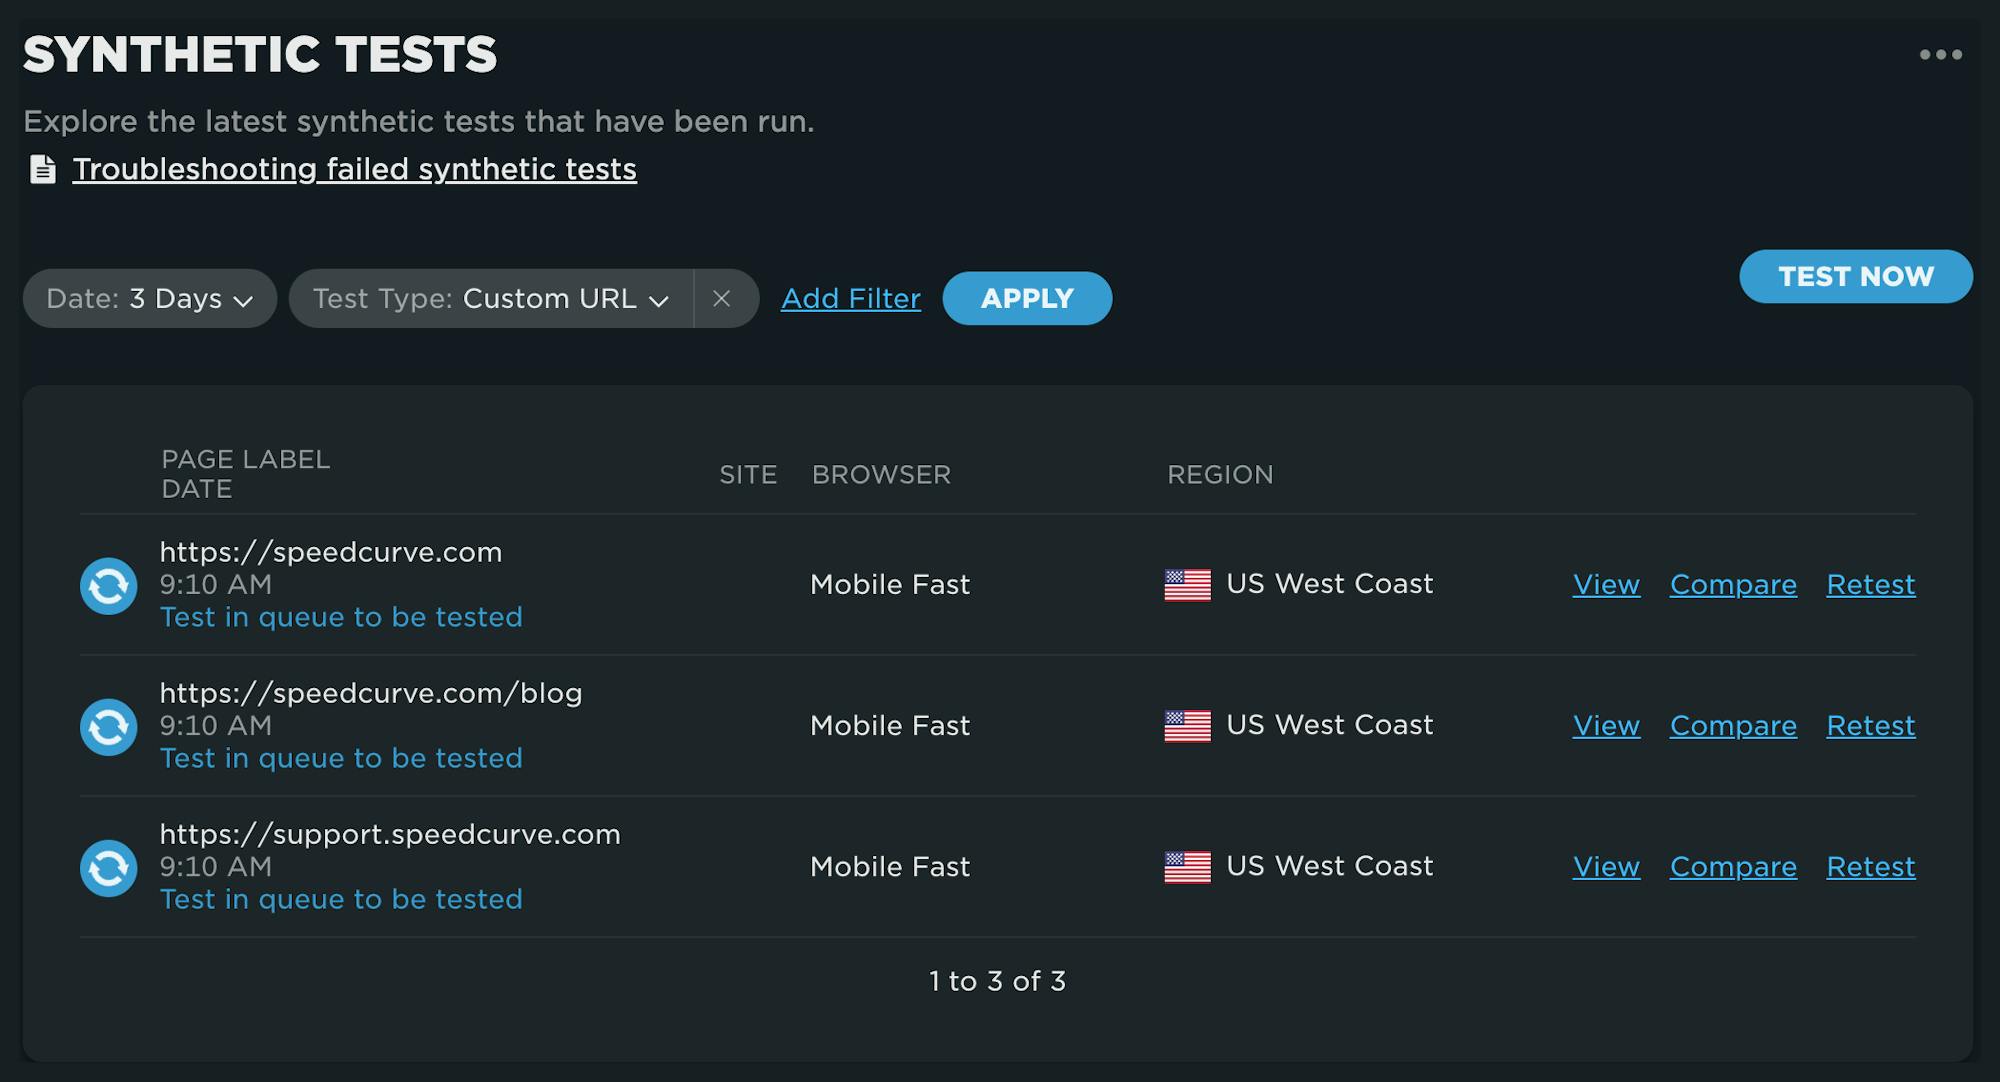
Viewing on-demand tests
Once your test(s) are kicked off, you'll be directed to the Synthetic Tests dashboard. From here, you can see the status and history of all of your tests – and even filter by test type.
For each test, you have the option to:
- View the results
- Compare the results with another test
- Retest with the same on-demand settings
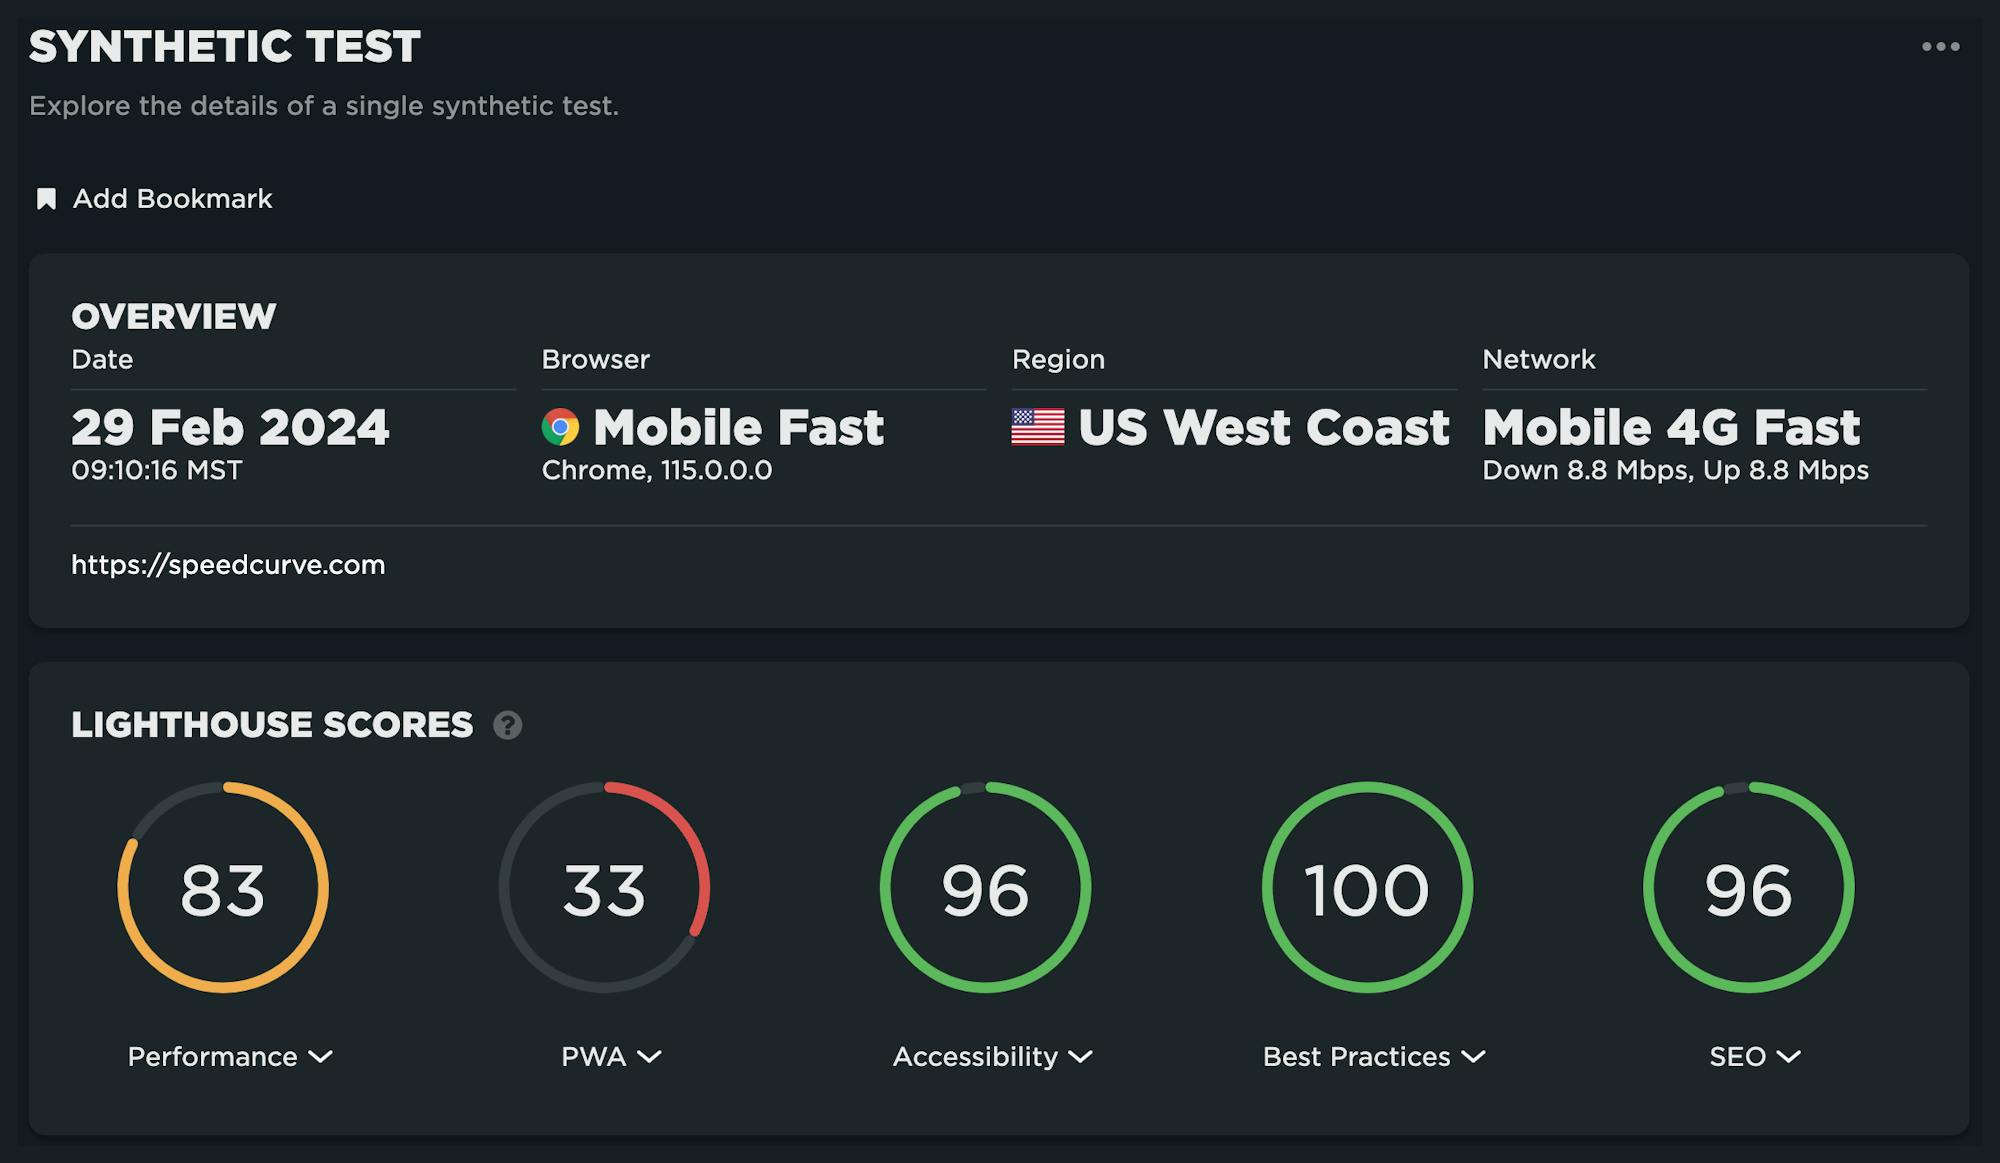
Test details
Once your tests have completed, the Test Details dashboard is ready for viewing.
If you are new to this dashboard, here is a summary of what's captured and displayed for every test.
Test overview and Lighthouse scores
- See what was tested, including your test settings
- Lighthouse results with details are provided for every synthetic test
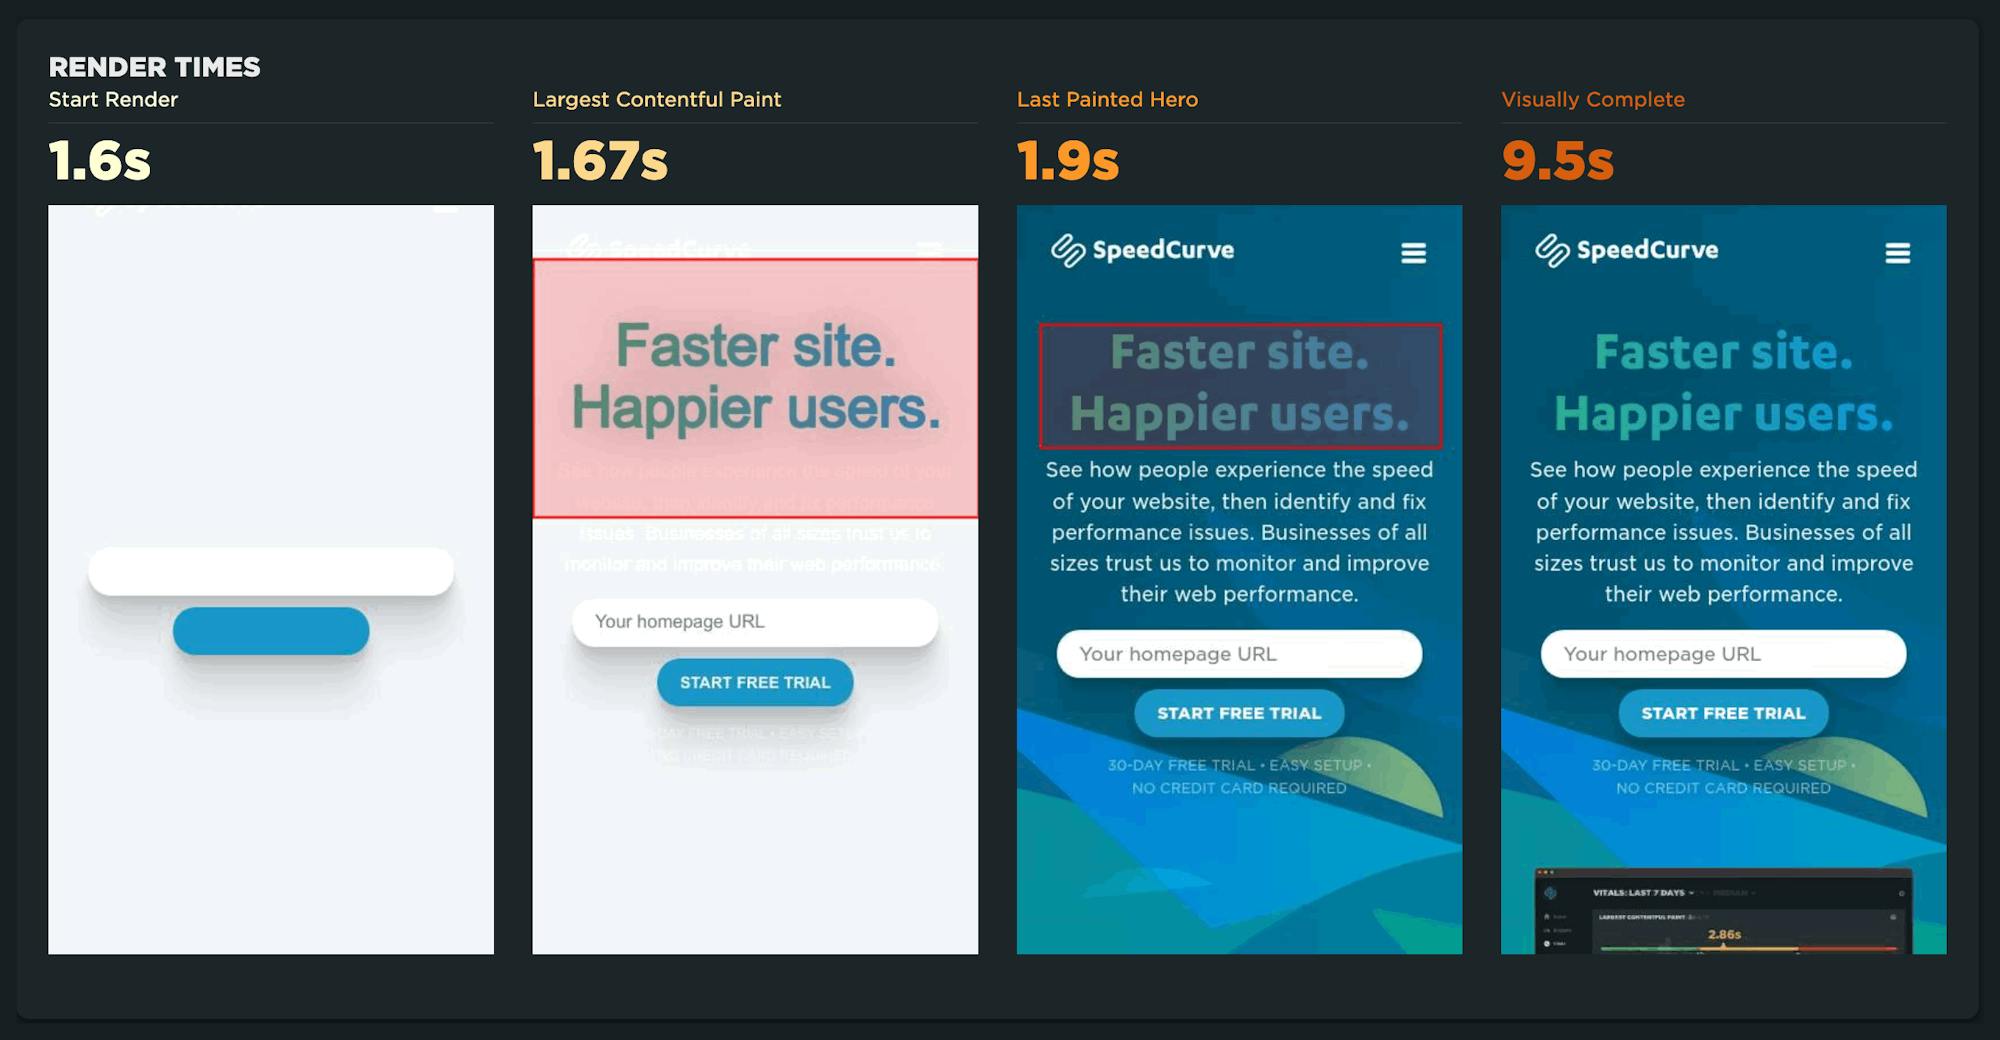
Render times
Key rendering moments of the page lifecycle are visualized with user focused milestone metrics. Both the LCP and Last Painted Hero elements are highlighted.
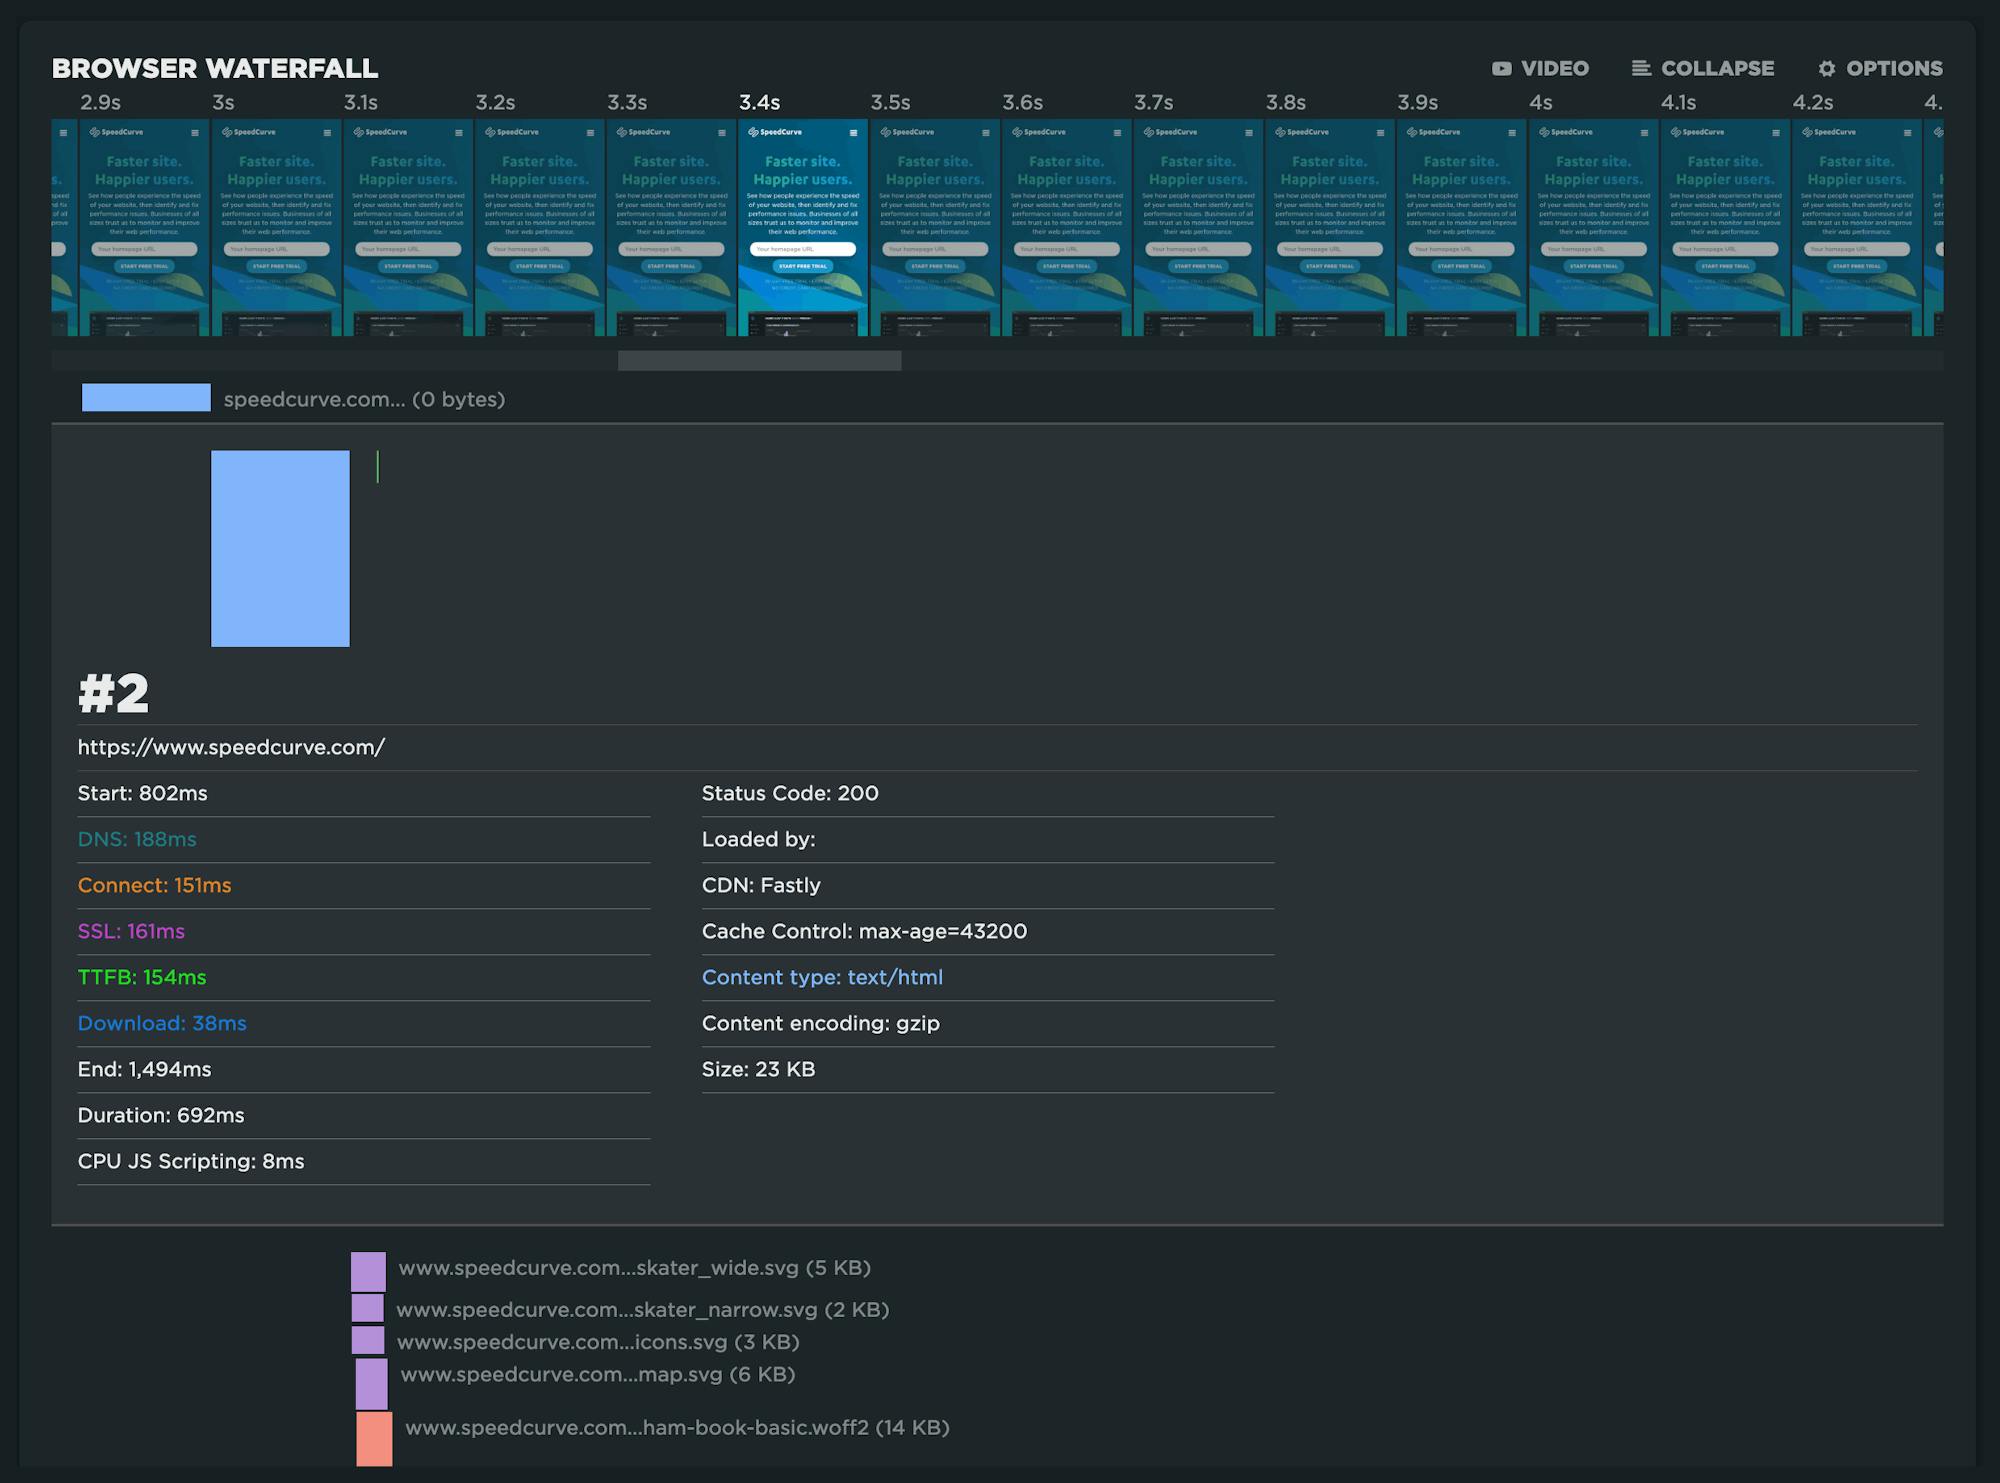
Compressed and expanded waterfall
The best of both worlds. Seeing a simplified event timeline makes it easy to understand how key metrics line up with the actual filmstrip through the use of a scrubber.
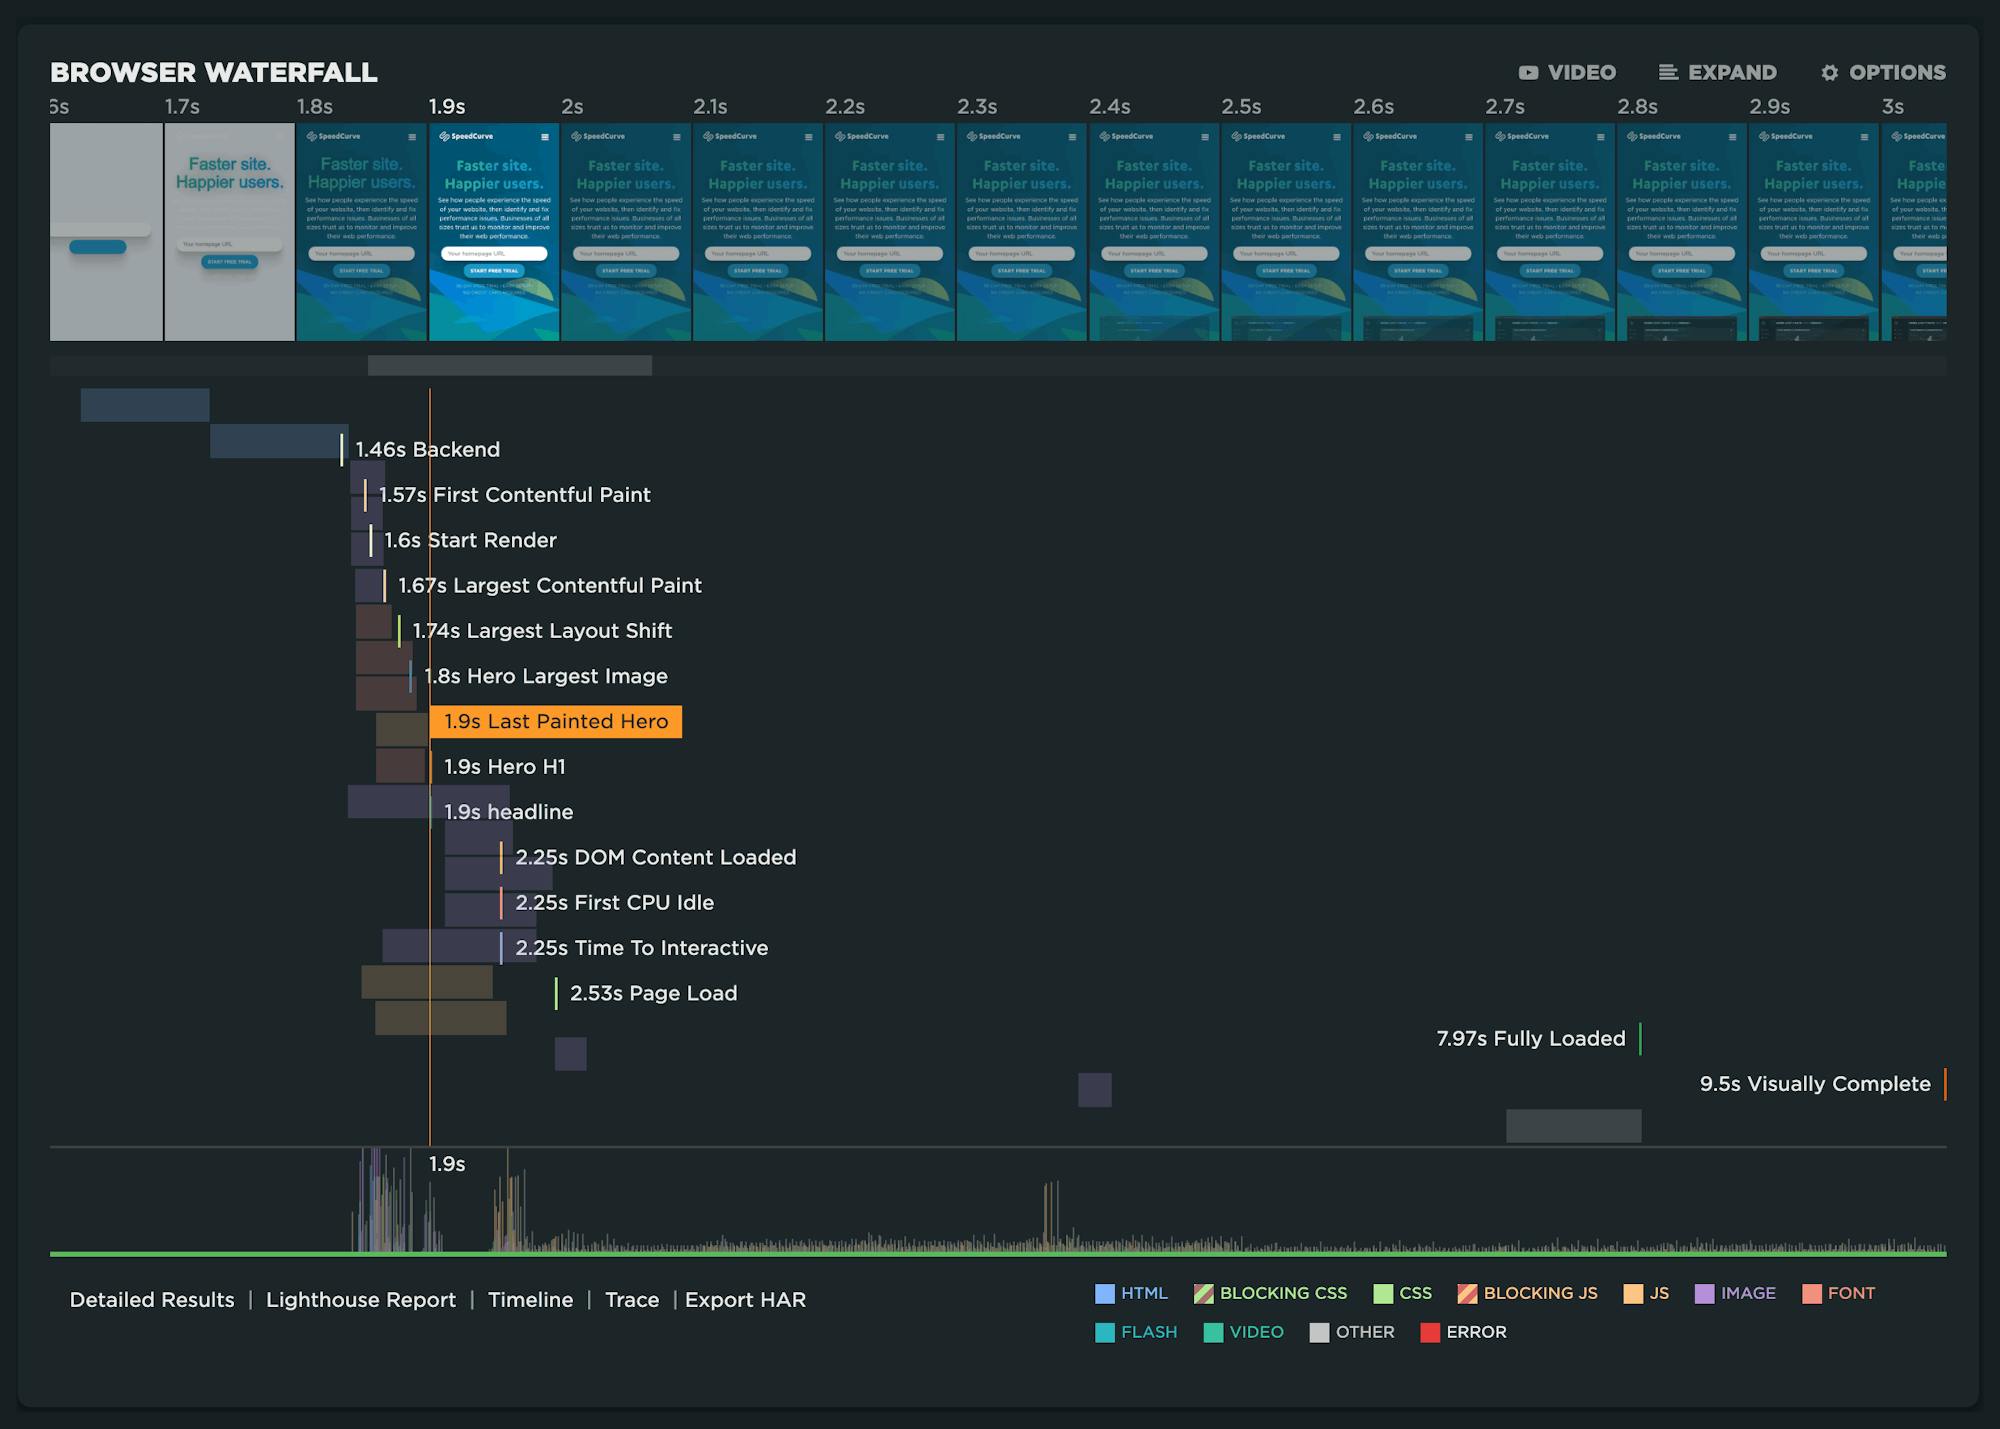
Expanding the waterfall exposes a great amount of detail for every request. If you are looking for more detail, click on 'Detailed Results' to see the full test results for every test run.
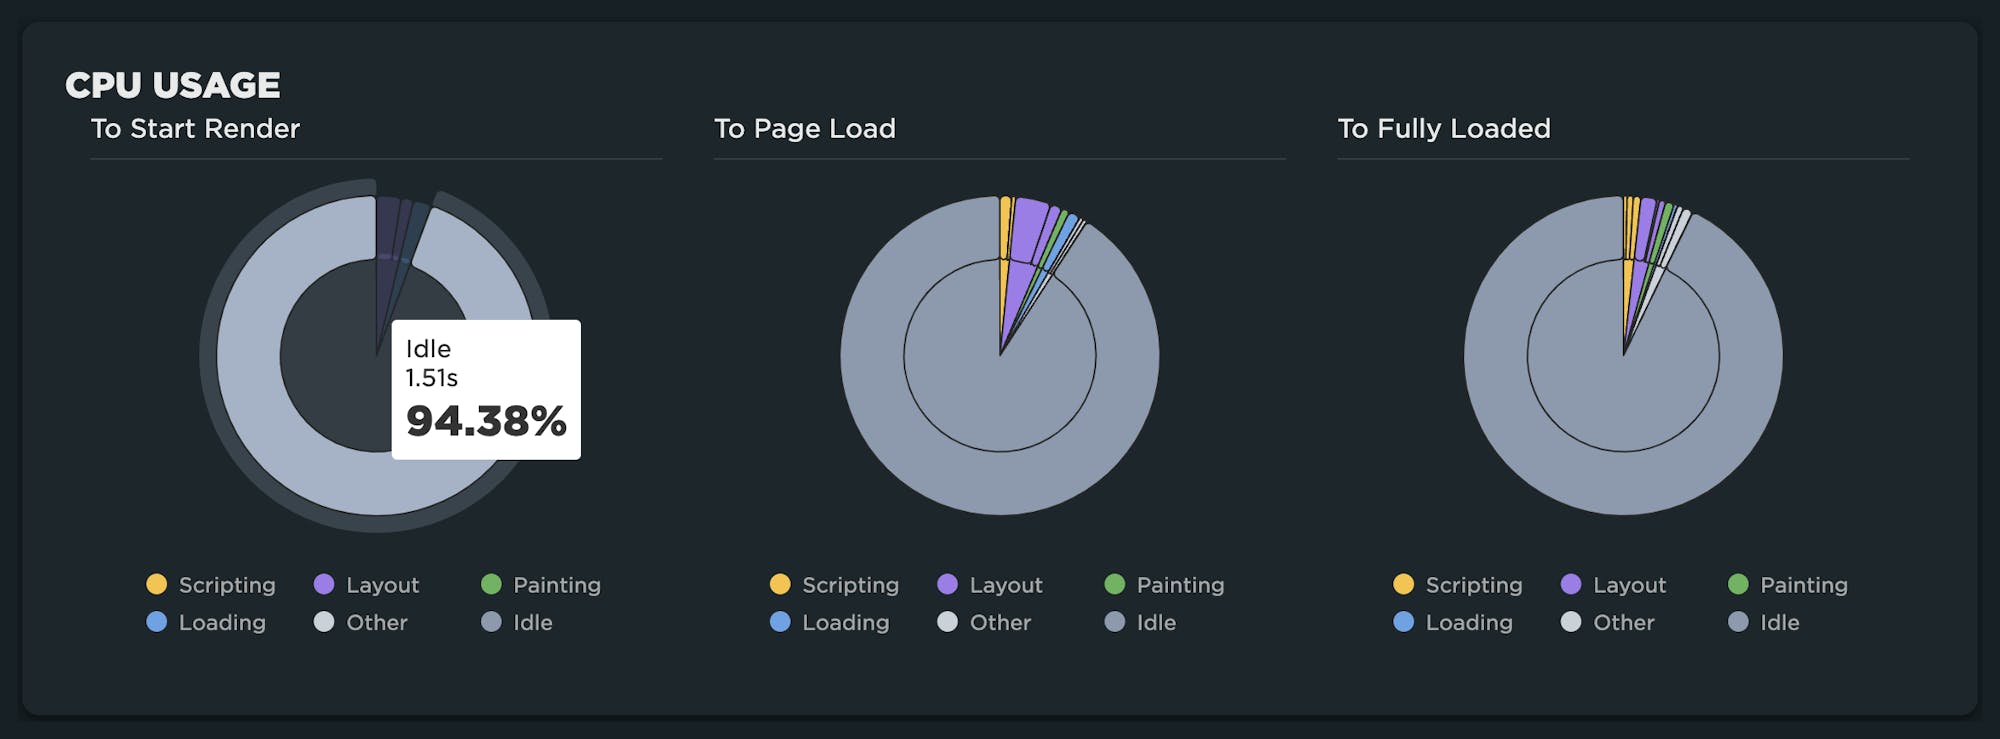
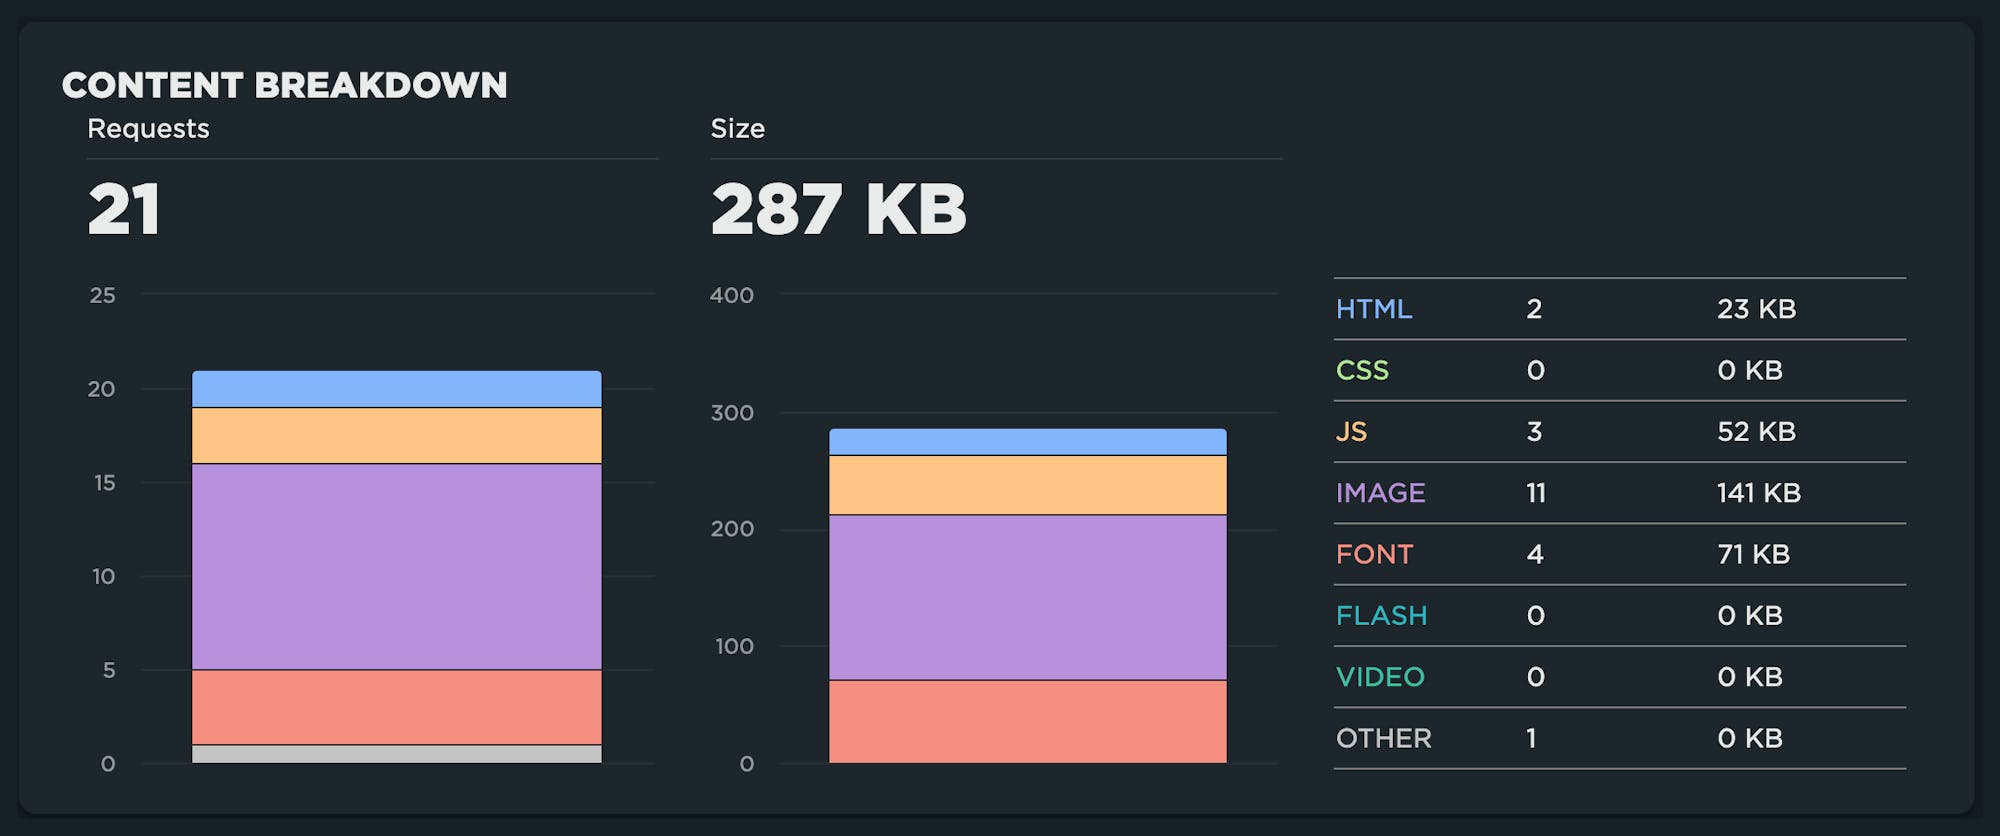
CPU and content breakdowns
Understanding the impact that JavaScript has on CPU usage can be seen in these visuals for three points in the page lifecycle: Start Render, Page Load, and Fully Loaded.
Page construction – both HTTP request count and size – is a helpful indicator of good/bad performance. This breakdown shows you how the content you choose affects the overall size, weight, and complexity of the page.
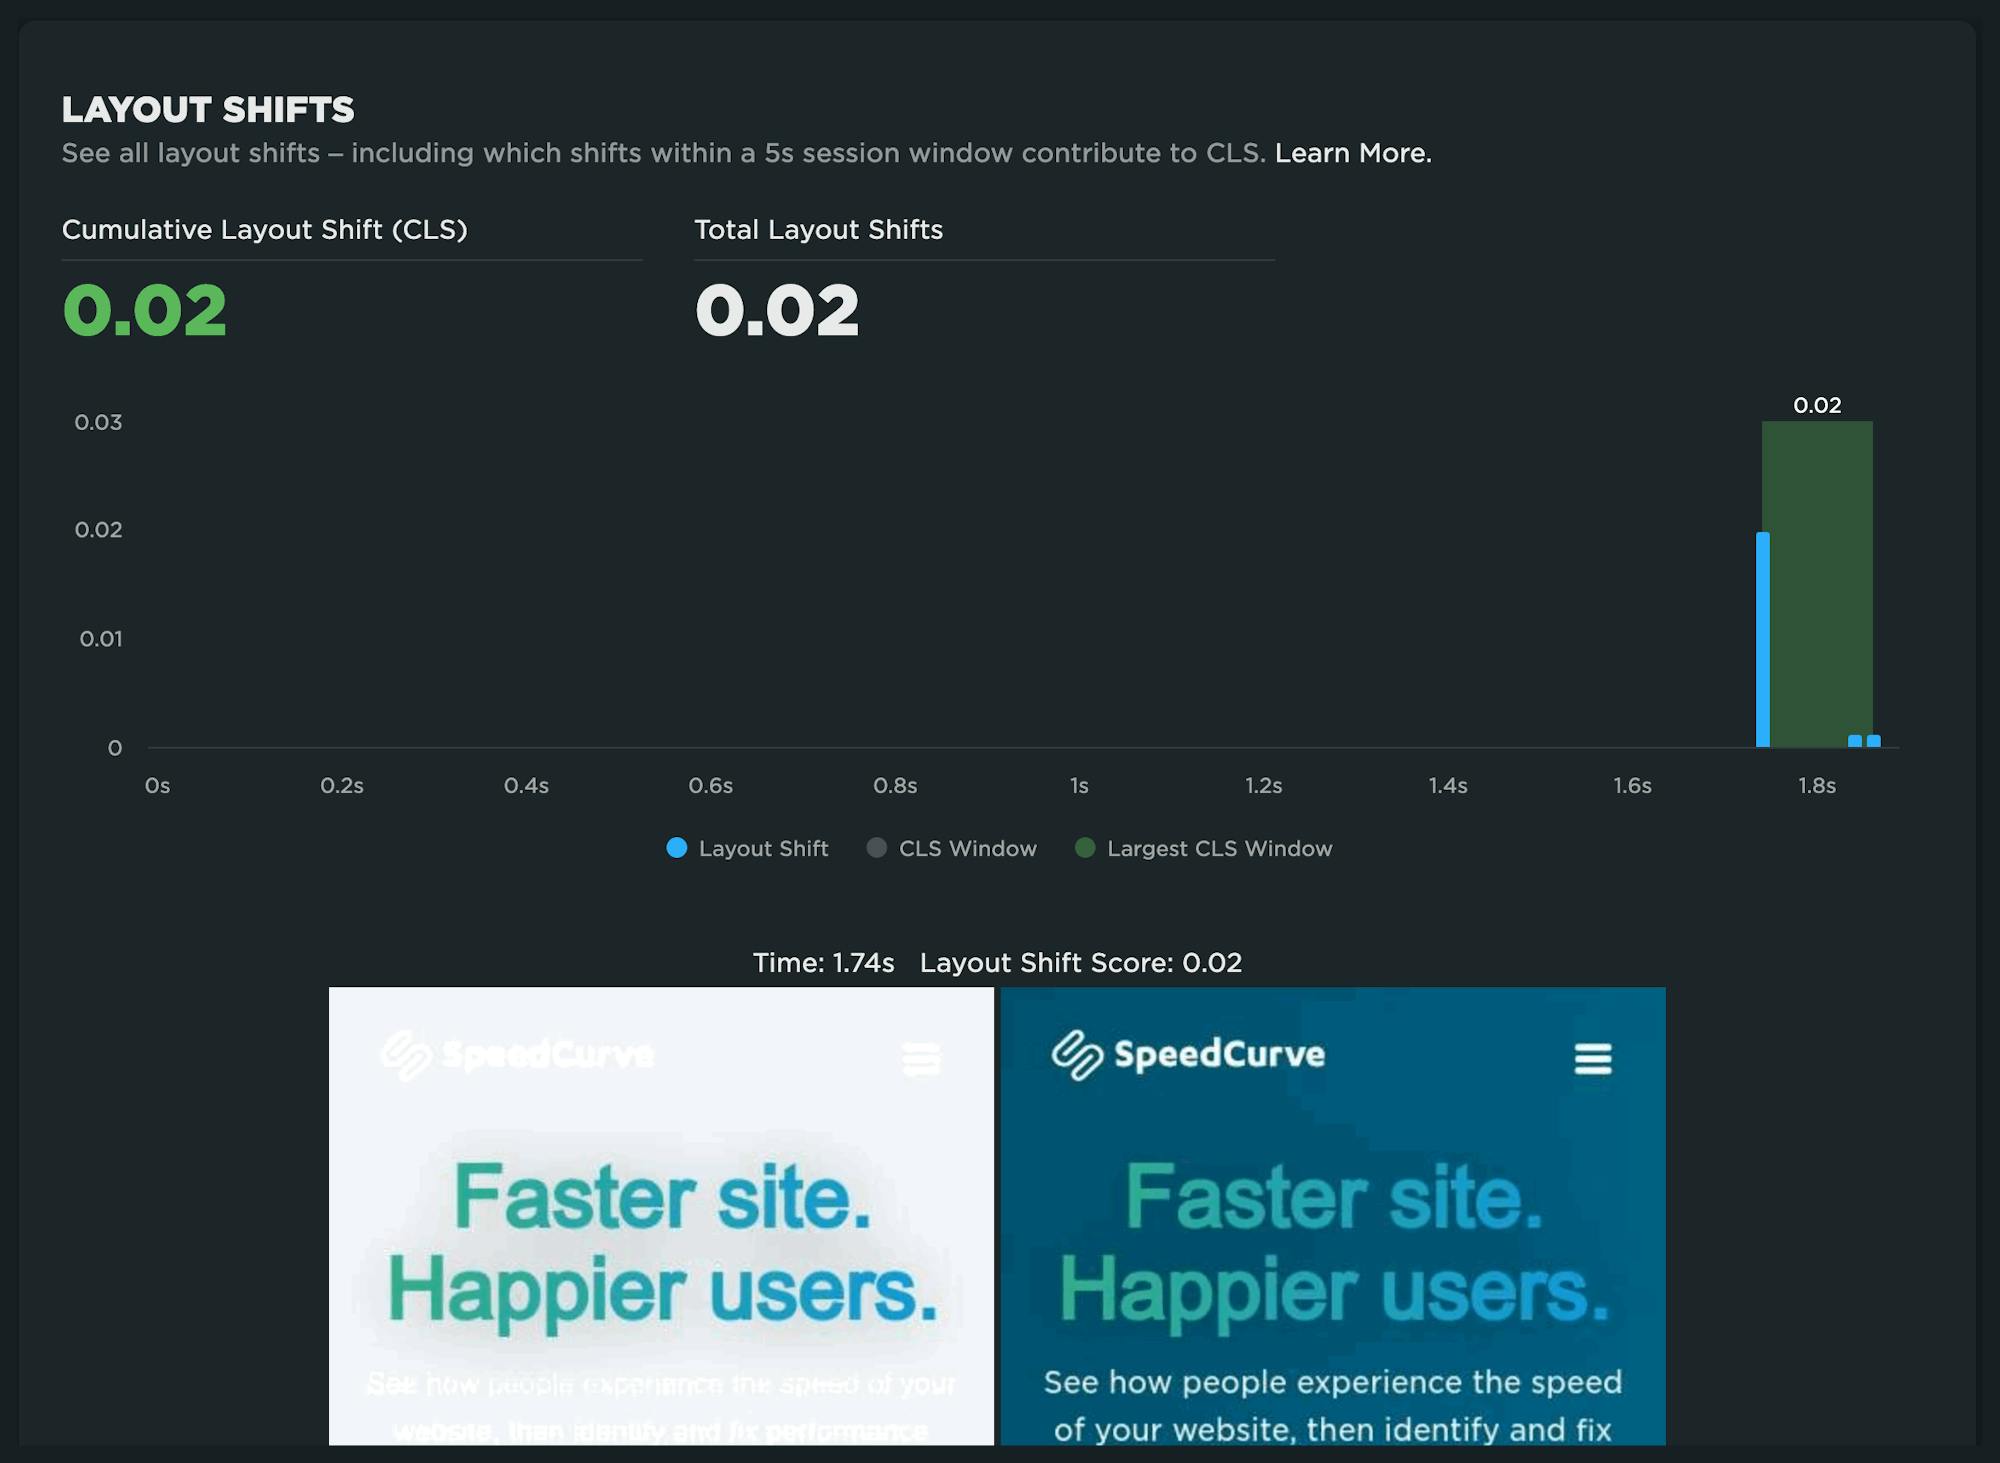
CLS diagnostics
Cumulative Layout Shift is broken down by each layout shift and displayed within session windows. Start with the largest layout shifts in the highlighted window first!
Grouping tests as a deployment
For all on-demand tests, you have the option to group them as a deployment. You'll want to add a name and any details you wish to include.
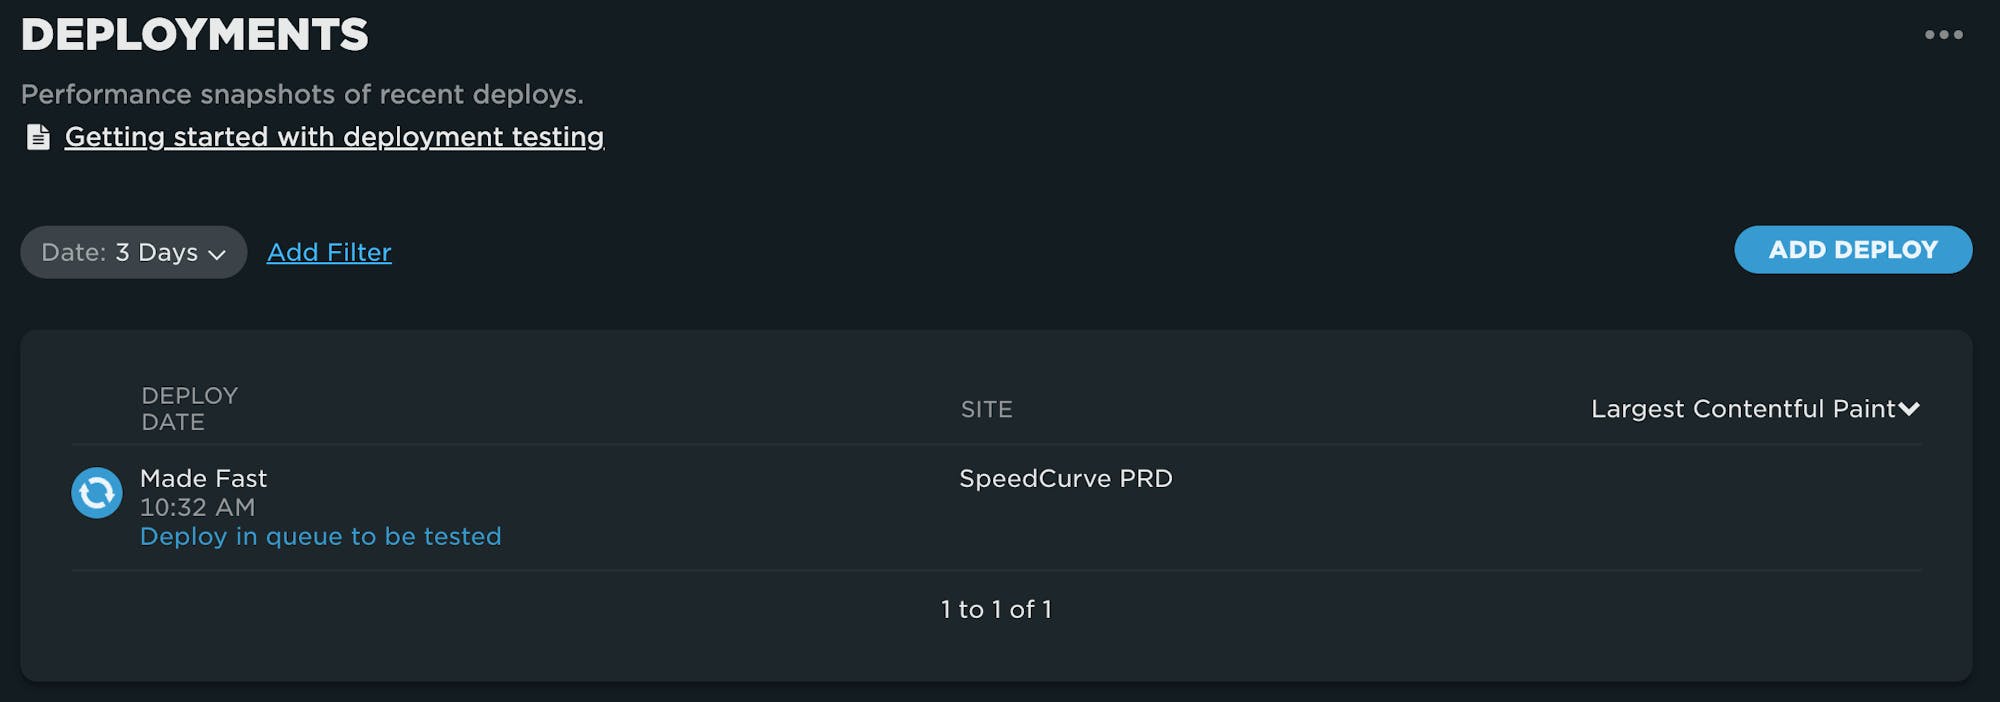
Once the deployment test(s) are triggered, you'll be taken to the Deployments dashboard in lieu of the synthetic tests dashboard to view your deploy.
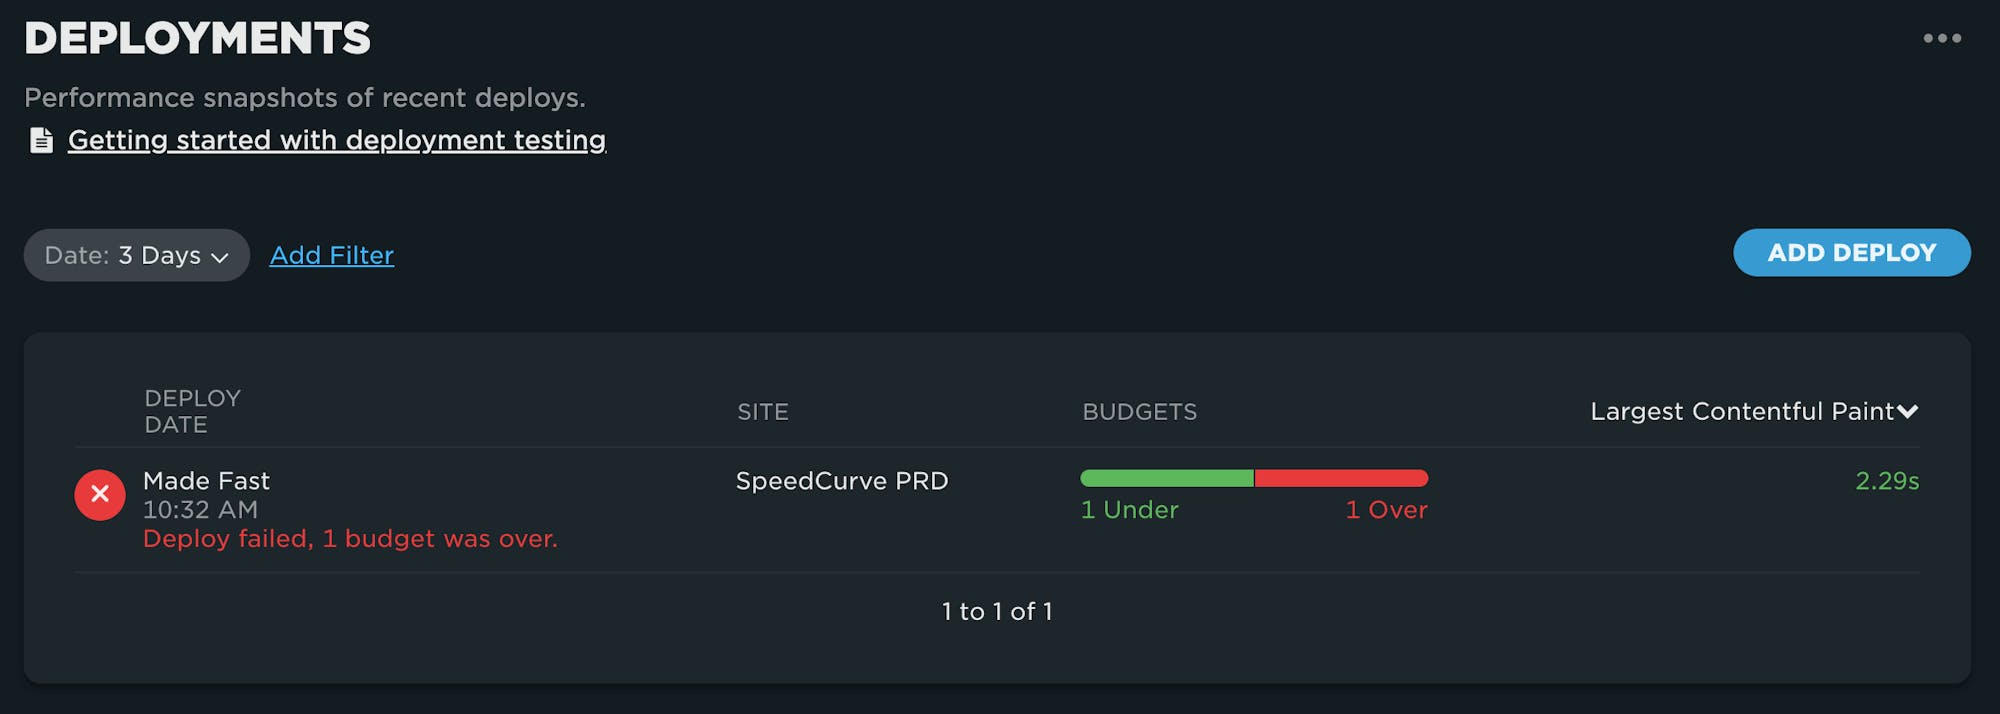
Once completed, you'll be able to see the high-level pass/fail results for the deploy.
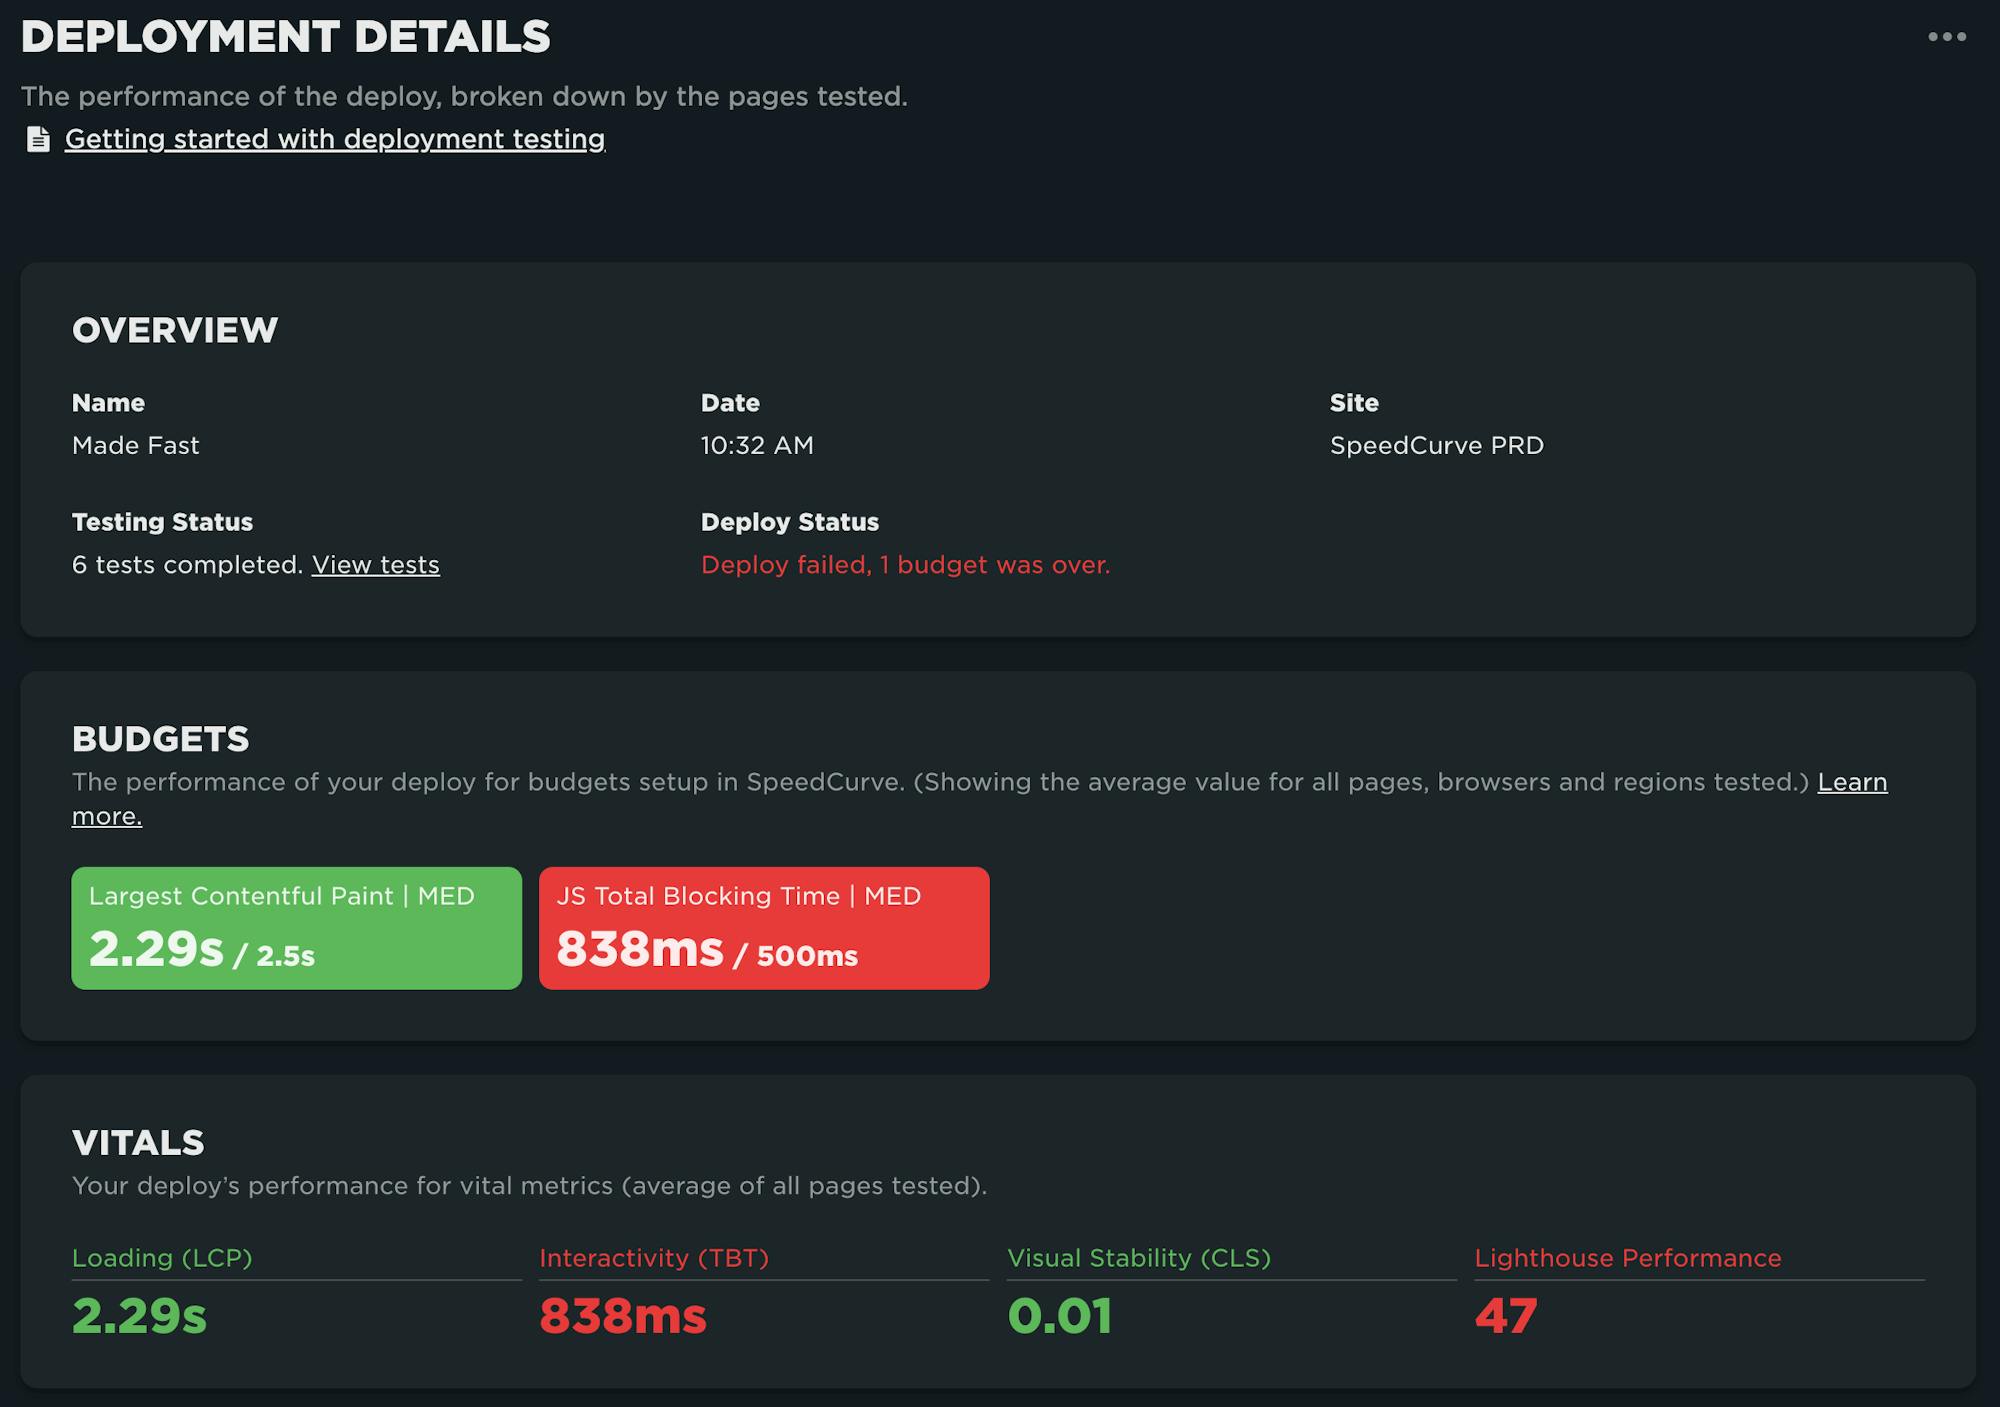
Clicking through to the Deployment Details gives you details around the deployment, including performance budget status, filmstrips, and more for each test in the deployment.
Read this article to learn more about deployments.
Summary
You asked, we listened. We hope you continue to get value from your testing in SpeedCurve with the on-demand testing capabilities we've introduced. As always, your feedback is welcome!
Not a SpeedCurve customer? Start a free trial today!

Read Next

Learn how to use our GitHub integration to fight regressions and keep your pages fast.
If you're not already using performance budgets to prevent regressions, you should be! Here's how to get started.