2023 recap: This year was all about making performance easy (well, easier)


Every year feels like a big year here at SpeedCurve, and 2023 was no exception.
Among other things, we turned ten! Ten years is a lot of time to reflect, and over this past year our team has been thinking a lot about not just the "what" and "how" of web performance, but also the "why". Why should we – and you – care about delivering a fast, delightful experience to all your users? This "why" informs all the choices we make about the "what" and "how" of our tools.
Looking back over the past year, if I were to pick a word that defined our goals, that word would be "easier". It's no secret that the past couple of years have been challenging for the tech community. In the current landscape of smaller teams, aggressive goals, and an ever-increasing tech stack, how can we make it easier for you to create impact?
Our biggest achievements this year have centred on making it easier for you to:
- Fight regressions and keep your sites fast
- Measure the impact of Core Web Vitals on actual user experience
- See correlations between site speed and business metrics
- Visualize your data
- Leverage synthetic and real user monitoring
- Focus on what matters
- Get help when you need it
Keep reading to learn more...
Easier to fight regressions
Integrating SpeedCurve into your development pipeline – so you can take advantage of performance budgets and alerts to catch issues before (or right after) they go into production – has been a popular practice over the last several years.

Our latest CI/CD workflow improvements have radically evolved the developer experience and the overall time to value for folks who use SpeedCurve in their CI/CD pipeline.
Easier to measure the impact of Core Web Vitals on actual user experience
It's been almost four years since the Core Web Vitals initiative was kicked off in May 2020. In that time, we've seen people's interest in performance dramatically increase, especially in the world of SEO. It's been hugely helpful to have a simple set of three UX-oriented metrics – focused on loading, interactivity, and responsiveness – that everyone can understand and focus on.
Over the past few years, we've done more than just support Core Web Vitals. We've analyzed them to validate their usefulness, and we've developed new ways to visualize your Vitals data to be as helpful as possible. Most recently, this includes:
Interaction to Next Paint
INP is intended to measure how responsive a page is to user interaction(s). This is measured based on how quickly the page responds visually after a user interaction (i.e. when the page paints something in the browser's next frame after you interact with it).
- We've added INP everywhere your Vitals are showcased throughout SpeedCurve – including the Home, Vitals, Performance, and JavaScript dashboards.
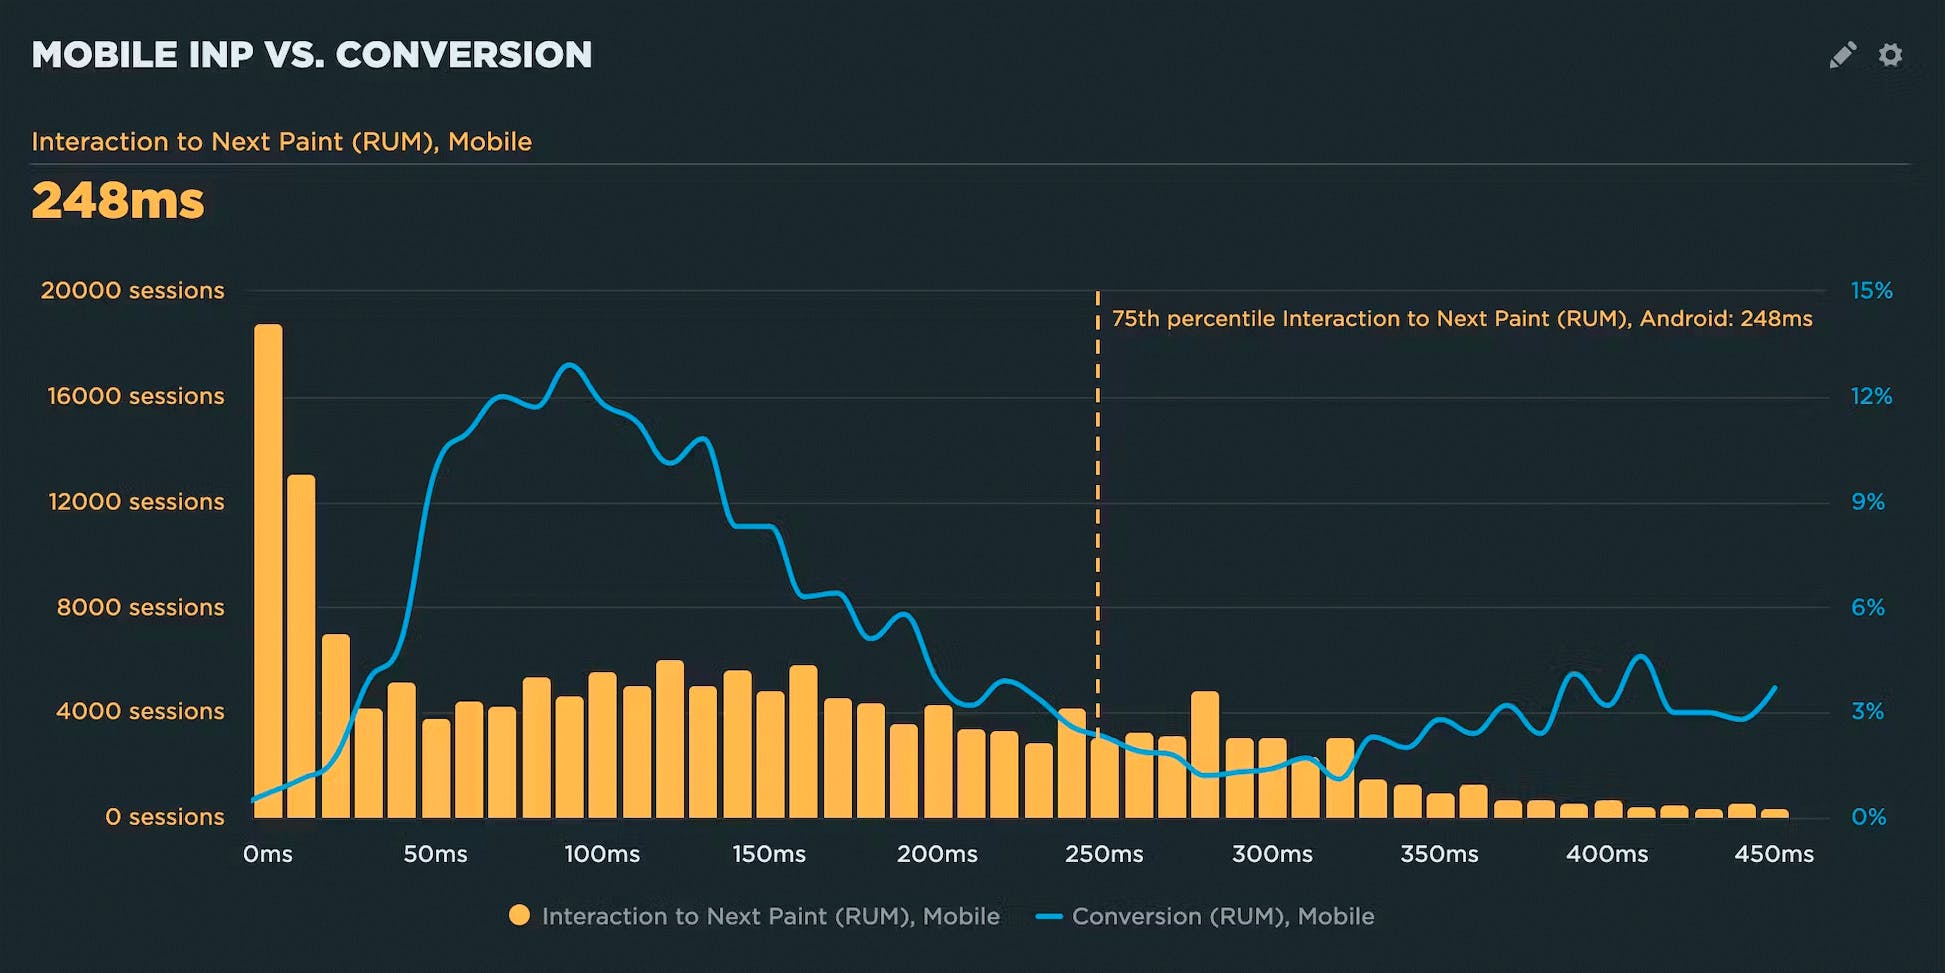
- We've also demonstrated how you can validate that INP correlates to user behaviour for your own site.
- And we've discovered that INP for mobile has an even stronger correlation with user engagement metrics than INP for desktop.
Cumulative Layout Shift
When CLS was originally launched, it measured all the layout shifts on a page. Unfortunately, this collided head-on with developers moving to single-page apps (SPAs). Since a SPA is by definition a full app shoved inside a single page, the CLS for a SPA would continue to grow for the lifetime of the app/page. This led to massive CLS scores for SPAs and a rethink of how CLS should be measured.
In 2021, Google relaunched CLS with a session window. The idea was to measure a burst of layout shifts within a 5s session window. A new session starts if there is a gap of more than 1s between layout shifts. At the end of the page lifespan, the session window with the highest total layout shifts becomes CLS. By introducing a session window, Google reduced the impact of the SPA problem. The CLS for any long-lived page was now limited to a 5s window containing the largest layout shifts.

To help people get their heads around CLS windows, we've introduced a new visualization (above) to SpeedCurve that shows you each session window, as well as which session is the largest and therefore used as the CLS score.
Element Timing: An alternative to LCP
Largest Contentful Paint is a sound concept for a metric, but sometimes it's not the right metric for your pages. This is where Element Timing comes in. Similar to LCP, Element Timing measures when a DOM element is rendered, and it's available in synthetic and RUM. Unlike LCP, Element Timing allows you to do the following:
- Decide which elements you want to measure
- Measure more than one element on a page
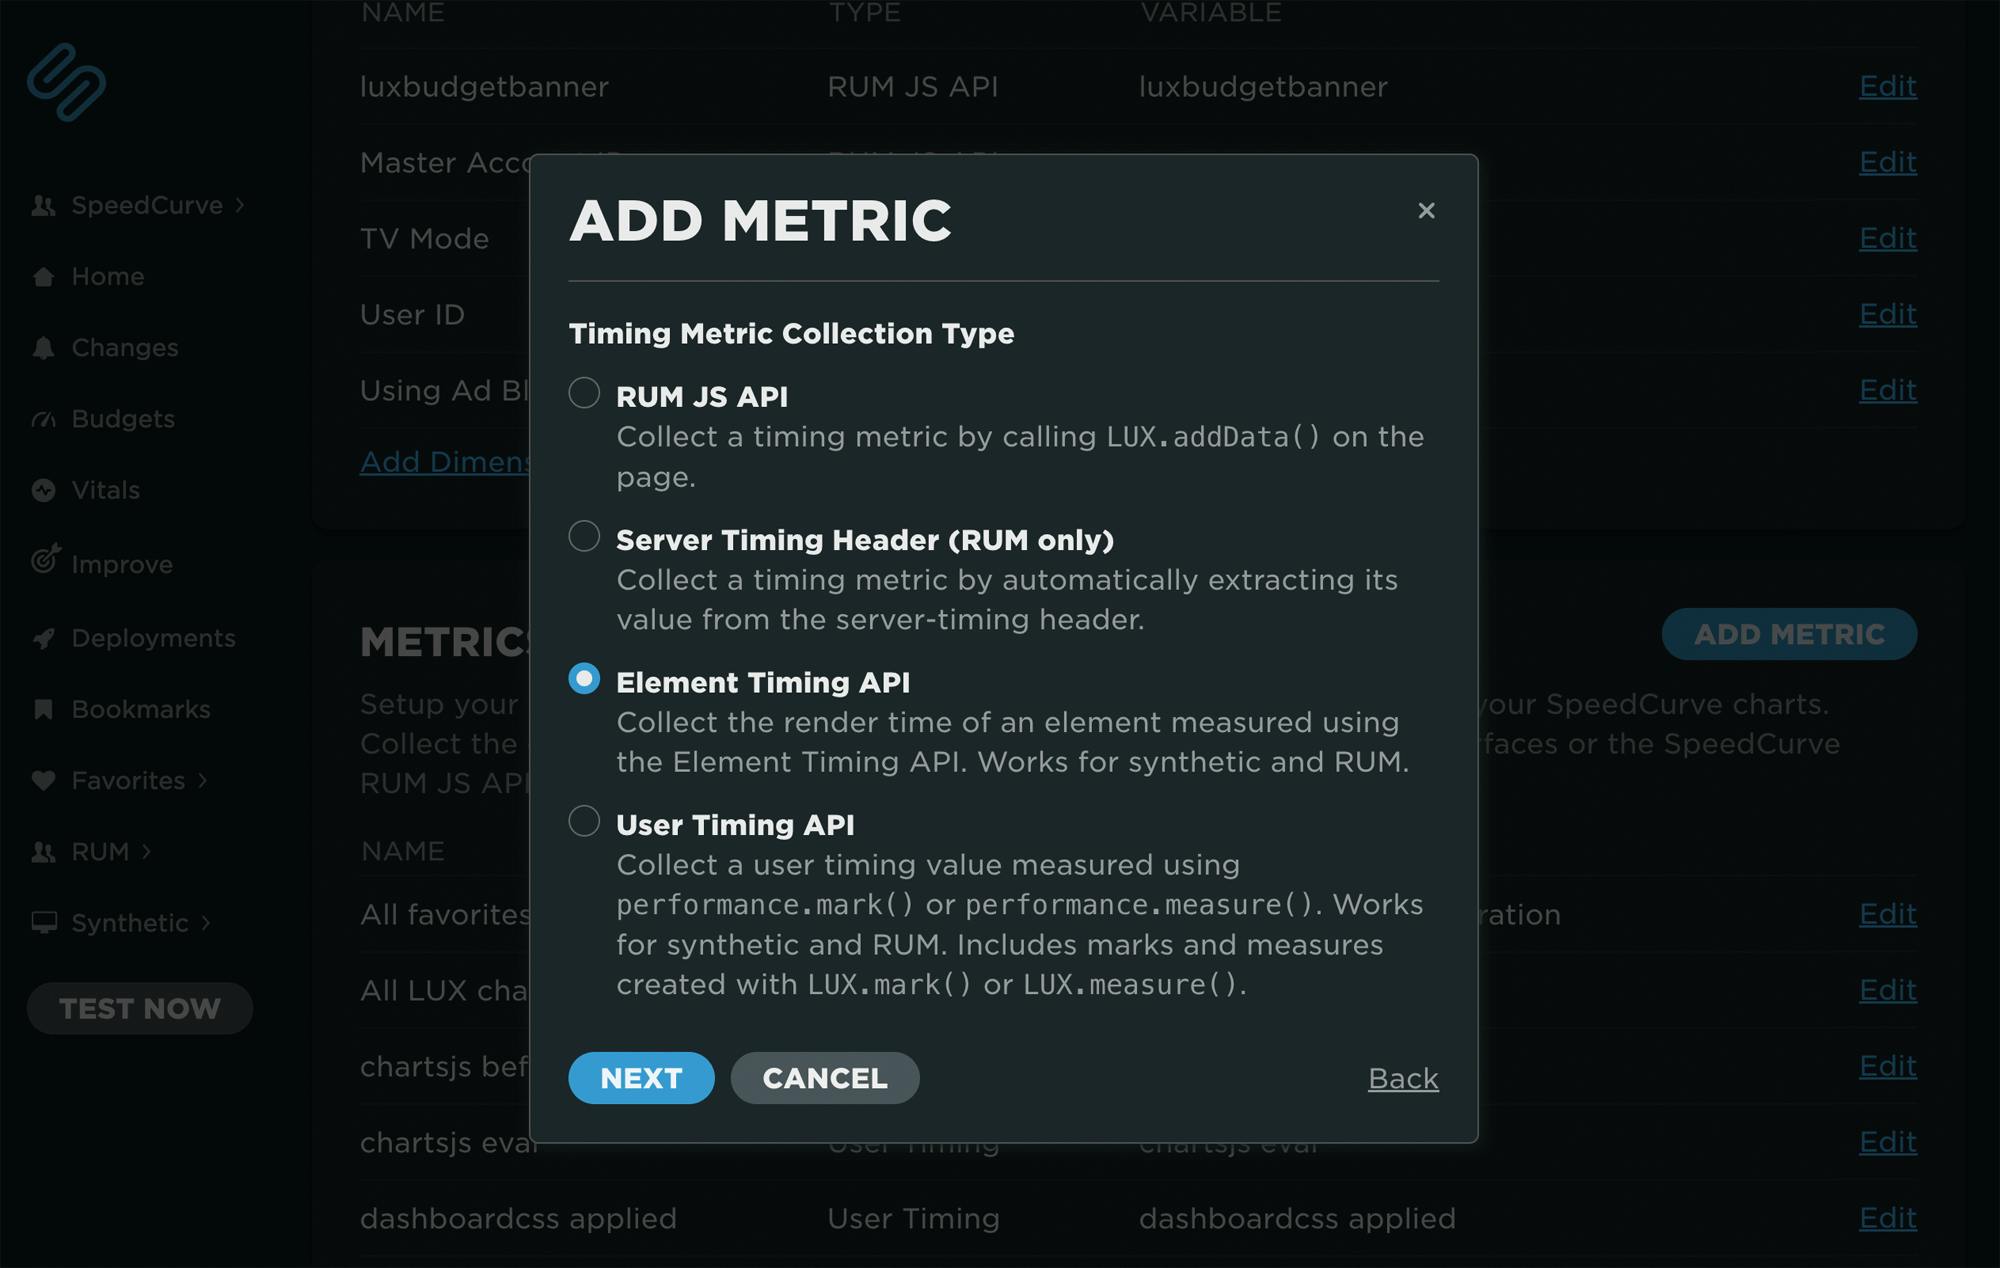
We've made enhancements to help you capture Element Timing data so you can always make sure you're measuring the most important content on your pages. Learn more here.
Easier to see correlations between site speed and business metrics
Earlier this year, I wrote about why you need to know the performance plateau for your site – the point at which changes to your website’s rendering metrics (such as Start Render and Largest Contentful Paint) cease to matter because you’ve bottomed out in terms of business and user engagement metrics. In other words, if your performance metrics are on the performance plateau, making them a couple of seconds faster probably won't help your business.
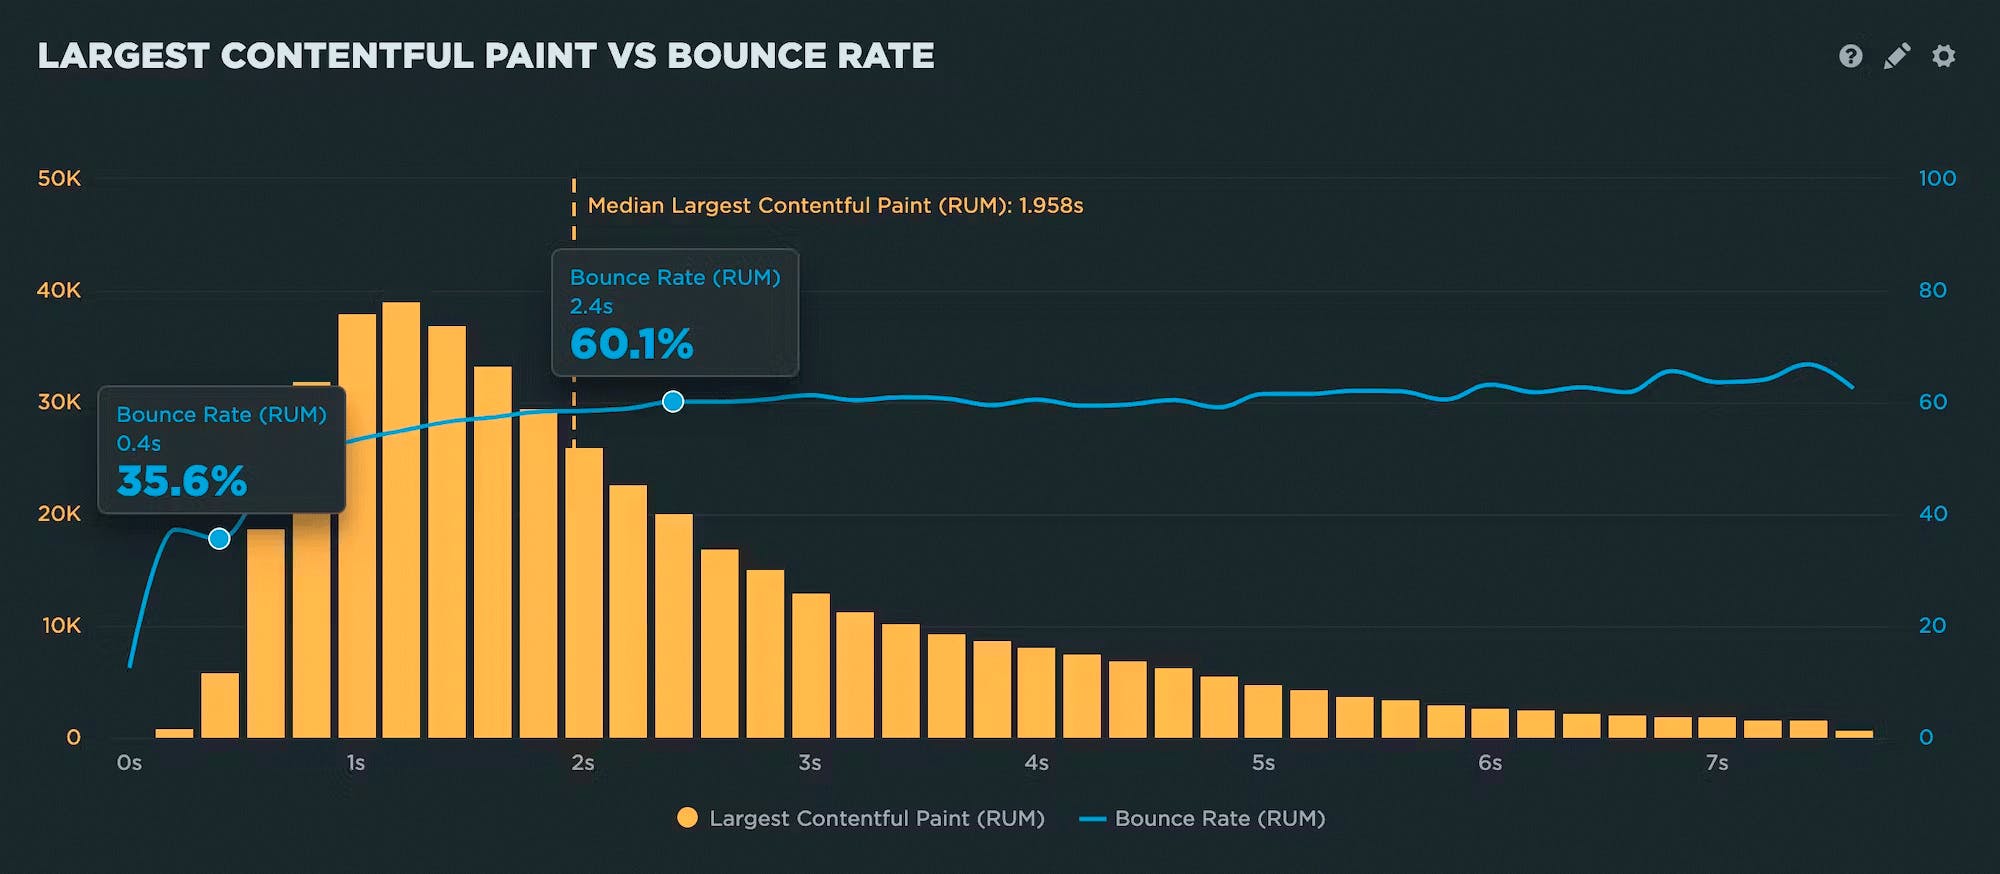
To find your performance plateau, first you need to create a correlation chart (above) that shows the relationship between your performance metrics and business KPIs. We've made it easier for you to add your own custom data – such as conversion data – to SpeedCurve.
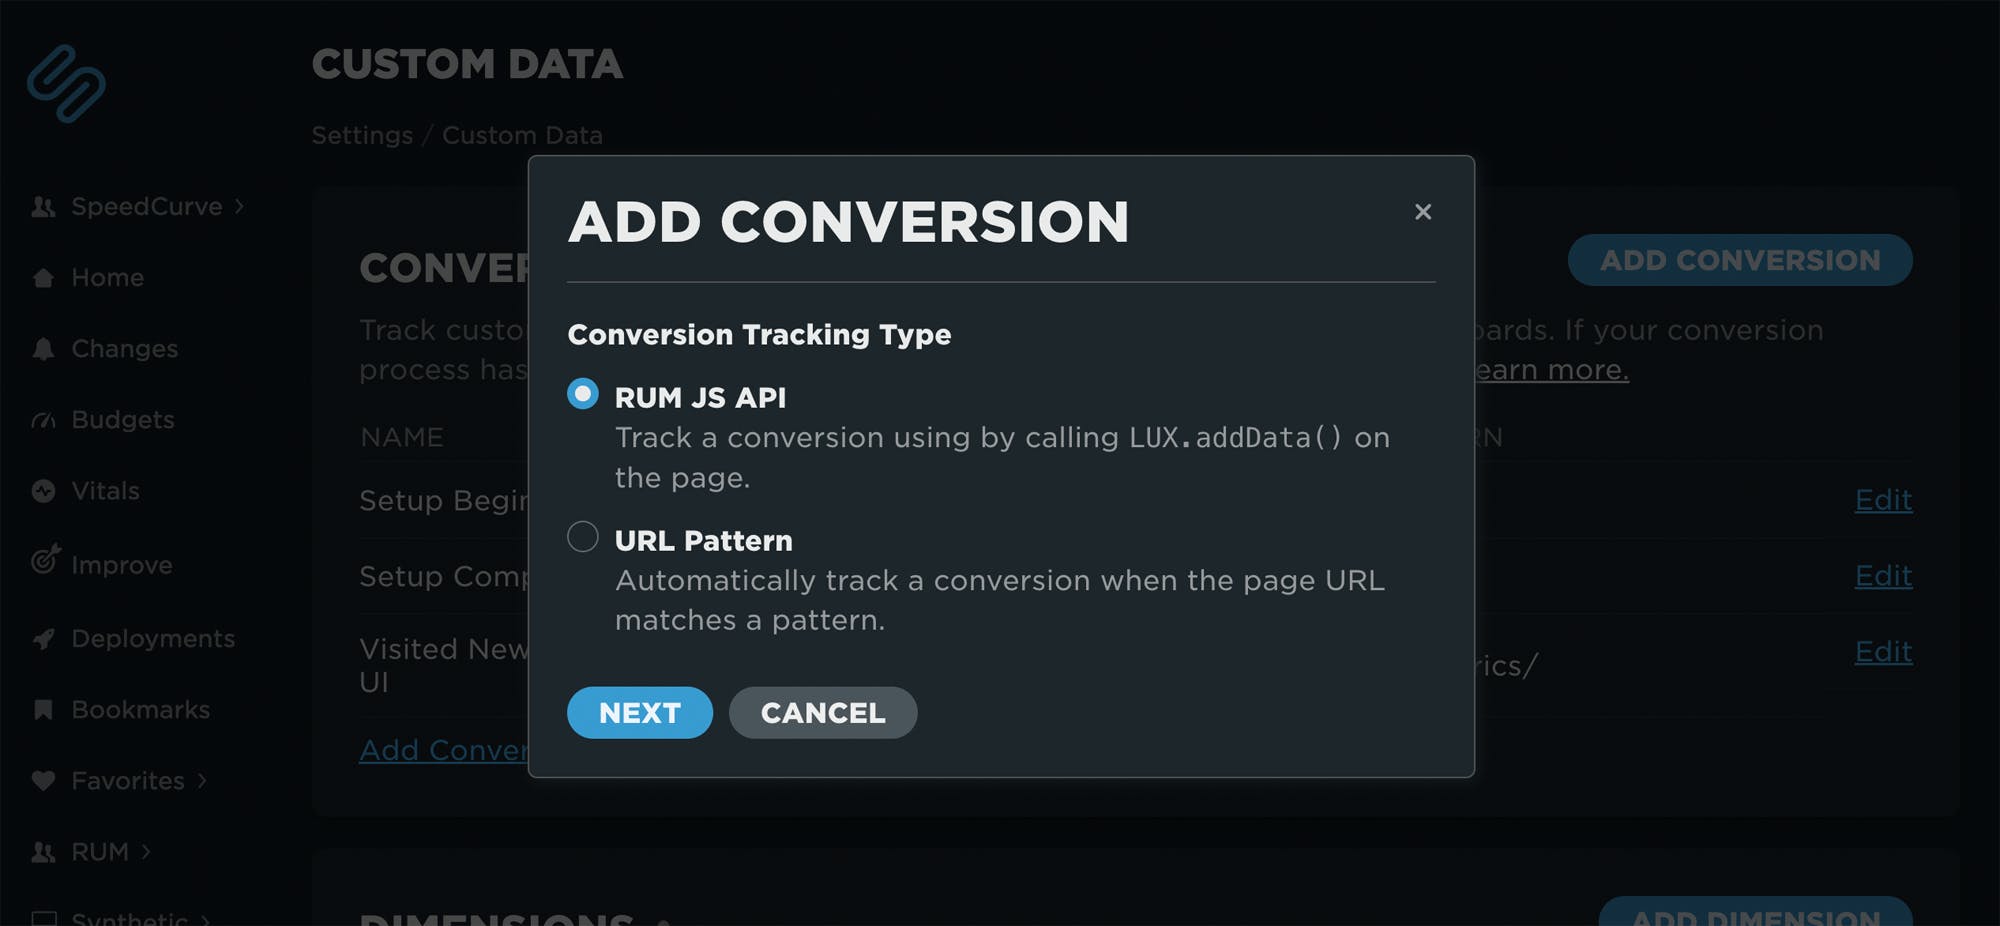
After you've added conversion data, you're all ready to create lots of compelling visualizations to get your organization to care about site speed.
Easier to visualize your data
We're always trying to create new ways to help you understand and share your web performance data as effectively as possible. This year we added and enhanced a few chart types.
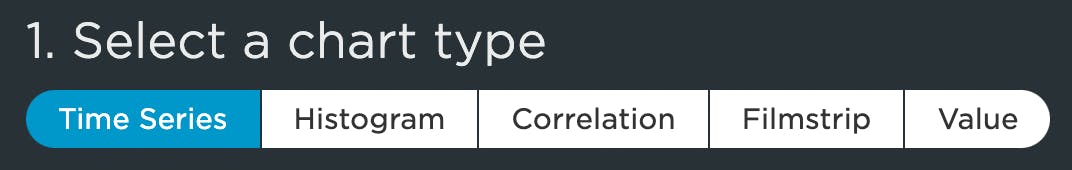
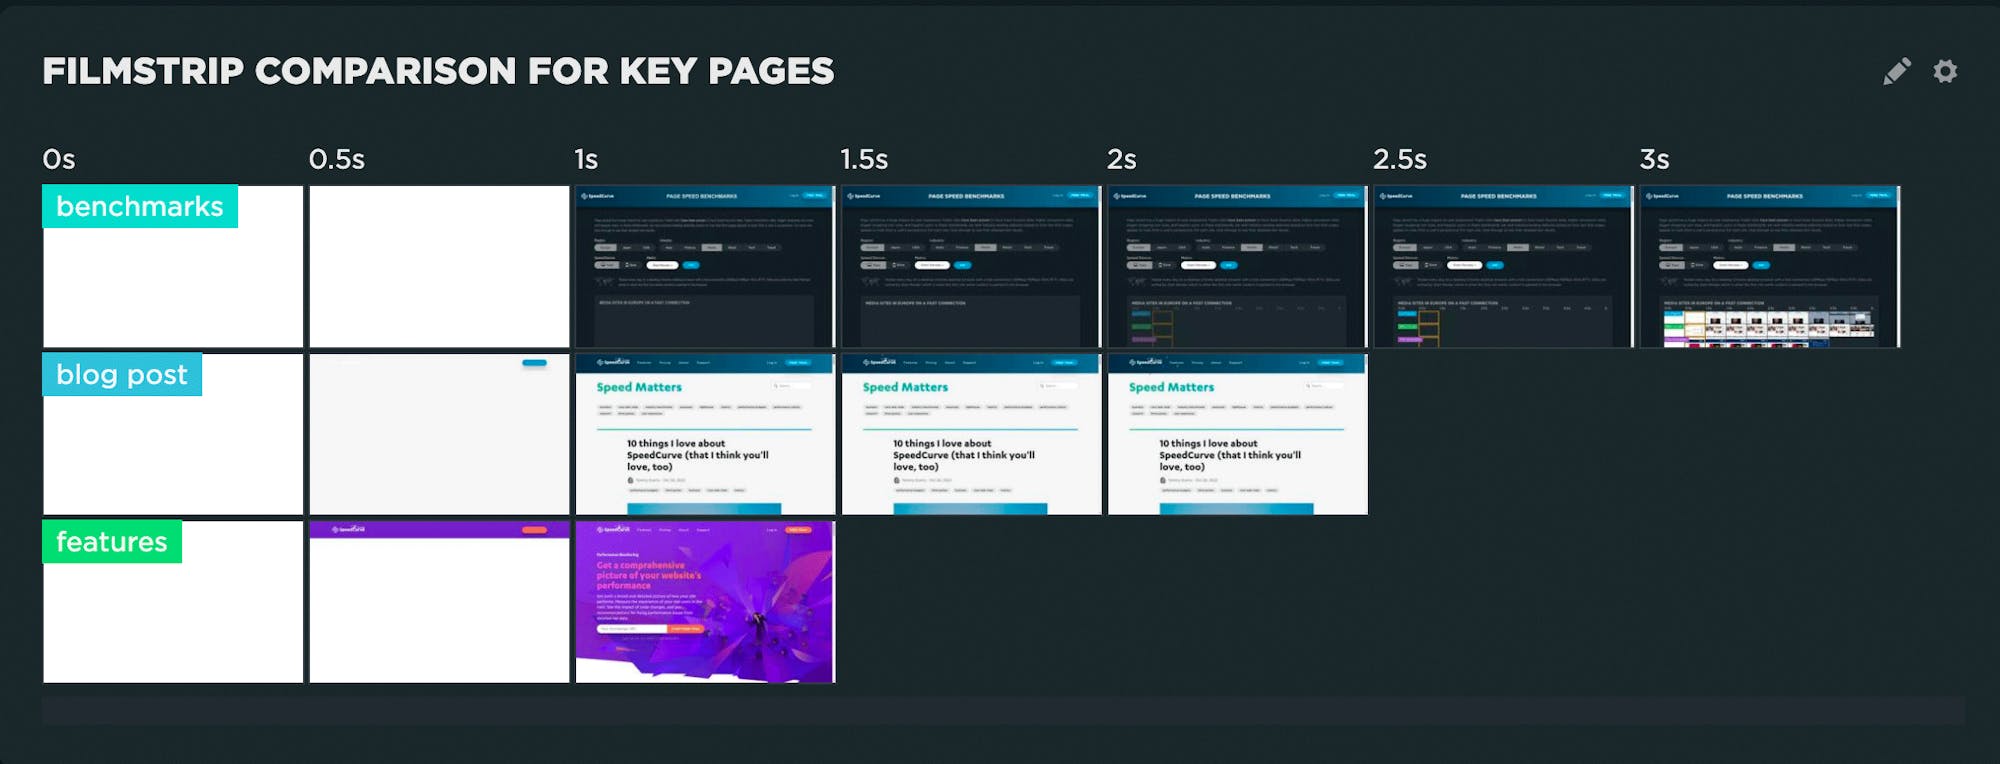
Filmstrip
Previously this ability was limited to curated synthetic dashboards. Now you can create your own filmstrip visuals in your Favorites to illustrate comparisons or show the impact of changes to the critical rendering path for your site.
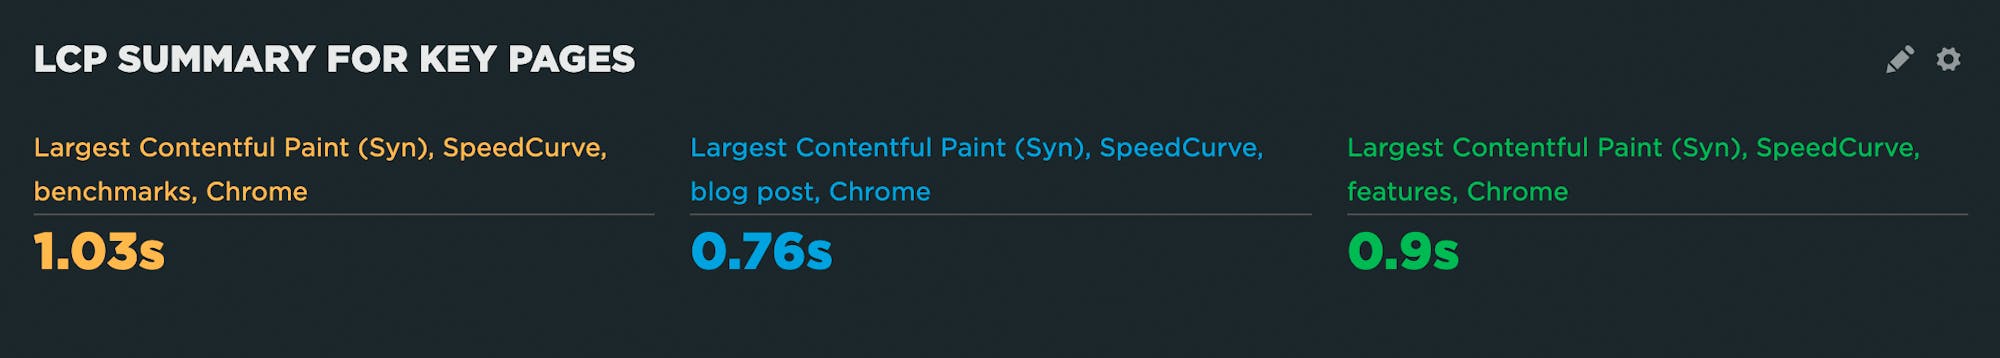
Value
Several users have asked for the ability to show 'numbers only' when creating a Favorites dashboard. This new chart type does just that. Value charts can be useful for reporting or when you want to show a lot of numbers in a dashboard, but don't necessarily want the noise of time series data.
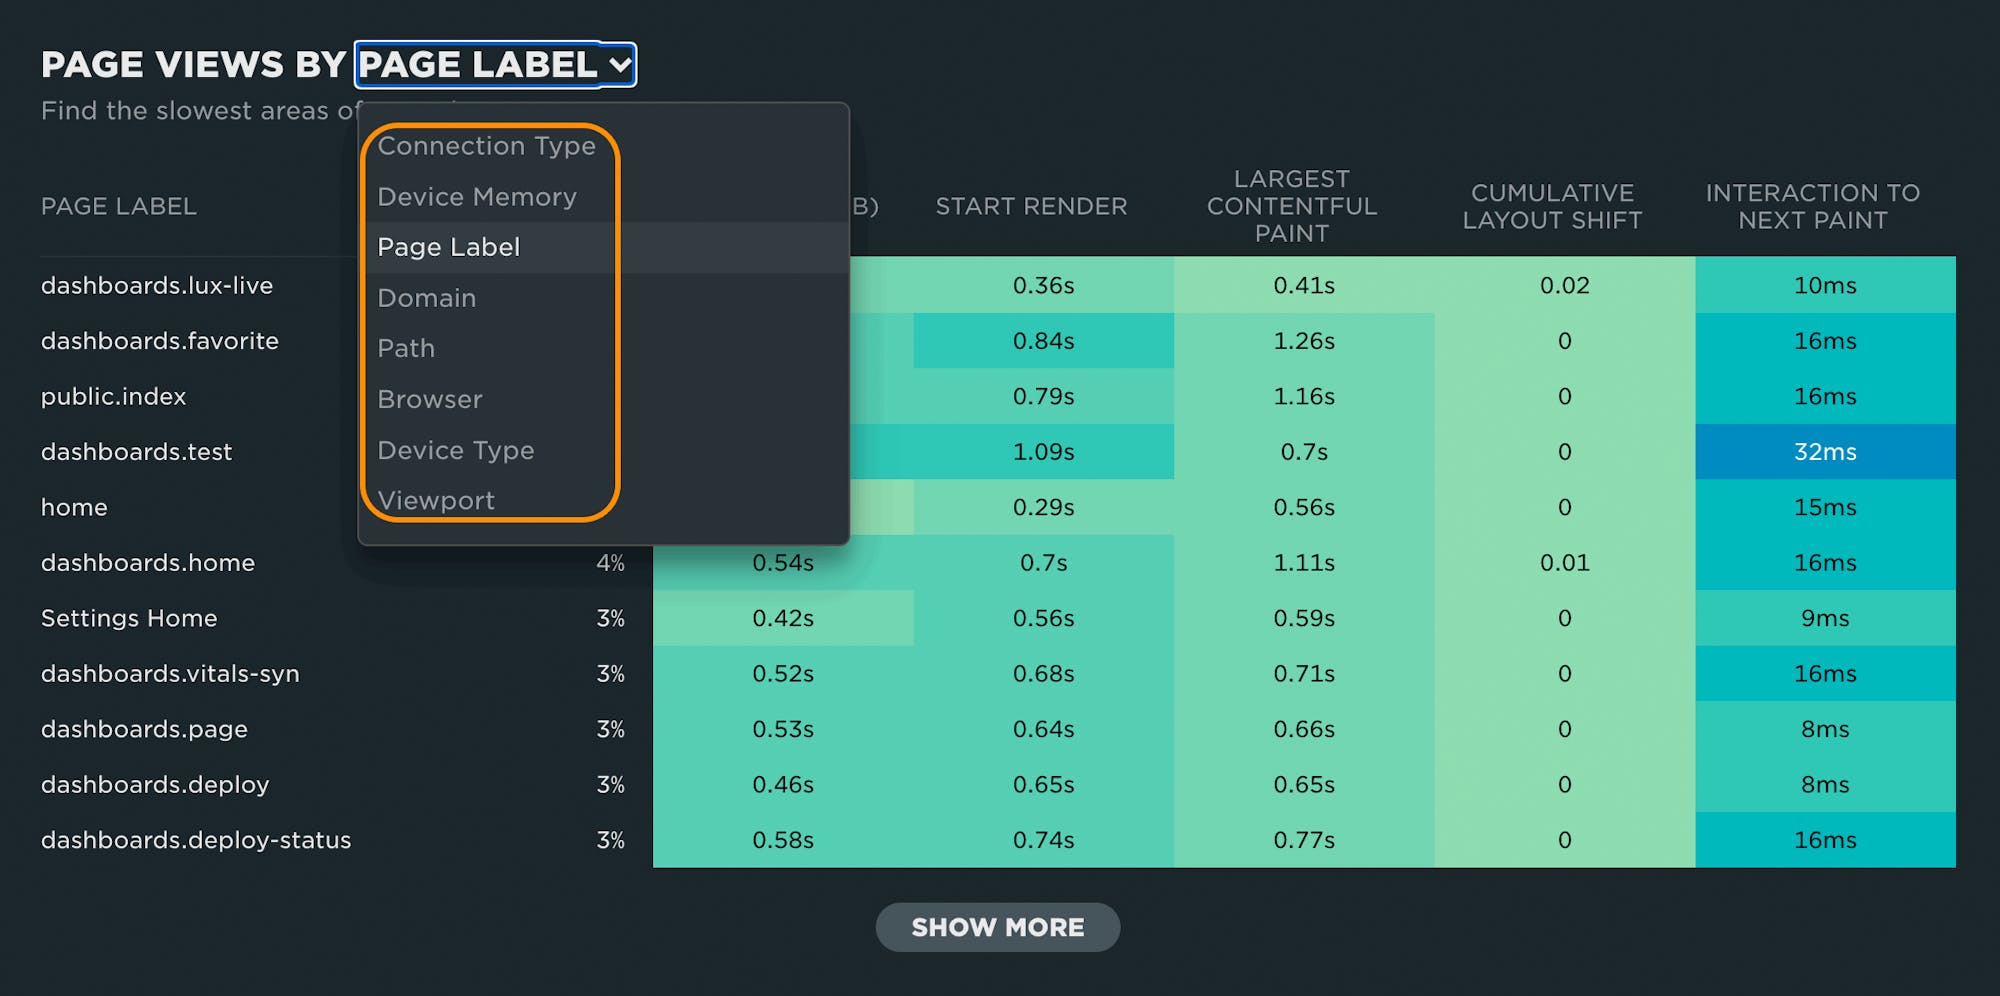
RUM heatmap
RUM heatmaps (found on your RUM Performance dashboard) have been updated to include:
- Interaction to Next Paint (INP) – The heatmap now includes all Core Web Vitals (LCP, CLS and INP) in addition to Backend Time and Start Render. Now you can see at a glance which pages are suffering from poor Vitals, and which pages are in great shape.
- Dimension filter – Heatmaps are now filterable by dimension. While 'Page Label' and 'Path' remain popular options, seeing the breakdown across various out-of-the-box dimensions can help you quickly identify potential pain points.
Easier to leverage synthetic and RUM
We're always looking for ways to make it easier to extract actionable data from RUM, and lately we've taken some evolutionary next steps to make it easier for you to take advantage of having access to both RUM and synthetic data in your dashboards.
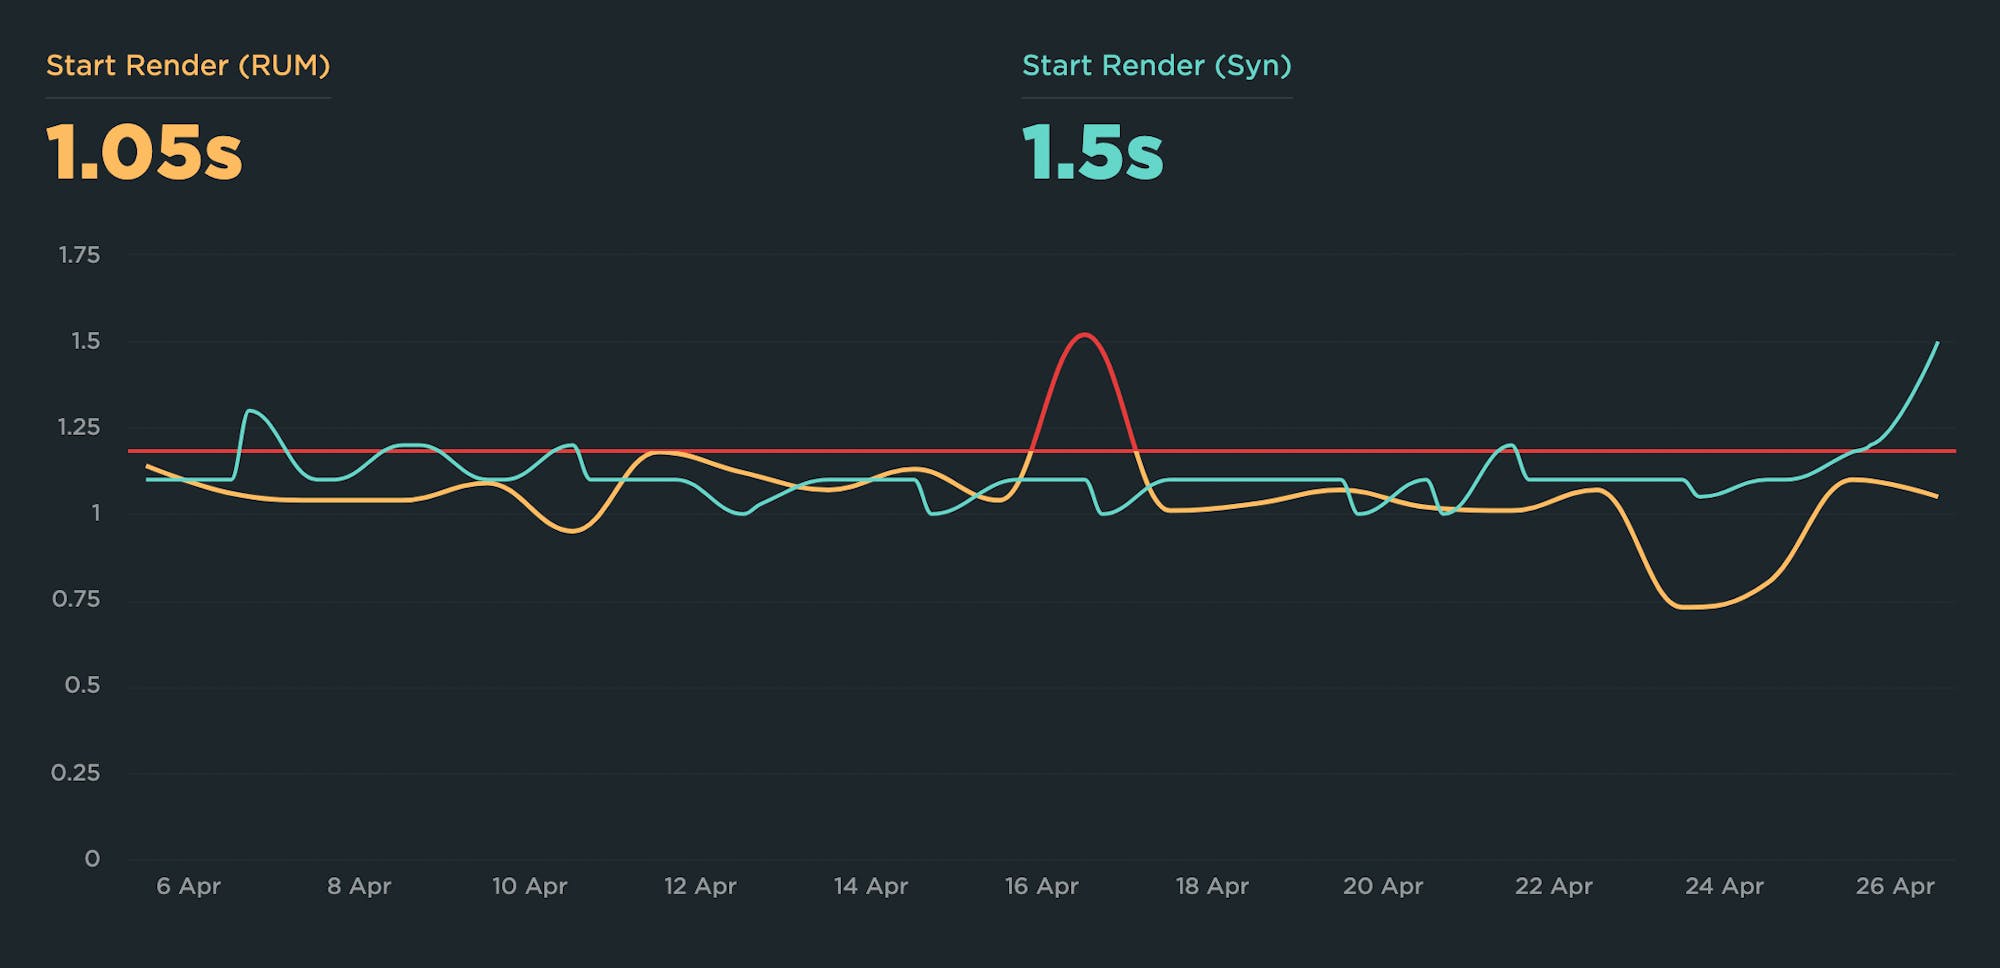
Applying the same labels to pages in synthetic and RUM allows you to do things like create a custom chart in your Favorites that tracks a metric (like Start Render, shown above) in both synthetic and RUM, set a performance budget so that you get an alert if the metric degrades in RUM, and then drill down into your synthetic diagnostics... all within a single chart. To help you do this, we've made it easier – not to mention given you more flexibility – to label your RUM page groups.
Easier to focus on what matters
It's easy to get overwhelmed with the sheer volume of performance work. This year at performance.now(), both Mark Zeman (SpeedCurve's founder) and I talked about how to focus on what matters most.
Mark's talk – Pushing Pixels – reminded us that not every pixel on a page has the same importance. Your users want to see the most important content first, while your ad team might want their content delivered early as well. Content elements need deliberate prioritisation, rather than trying to make the whole page fast. Mark pulled the idea of a "page" apart and explored a design and development pipeline that focuses instead on islands of content.
In my talk – Creating Performance Impact in a Changing Tech Landscape – I shared best practices to chase impact in our current landscape of smaller teams, aggressive goals, and an ever-growing tech stack. Topics included how to:
- Identify your critical rendering path
- Focus on the pages that matter
- Fix the low-hanging fruit
- Manage expectations
- Use performance budgets to fight regressions
- Quantify success – and brag about it!
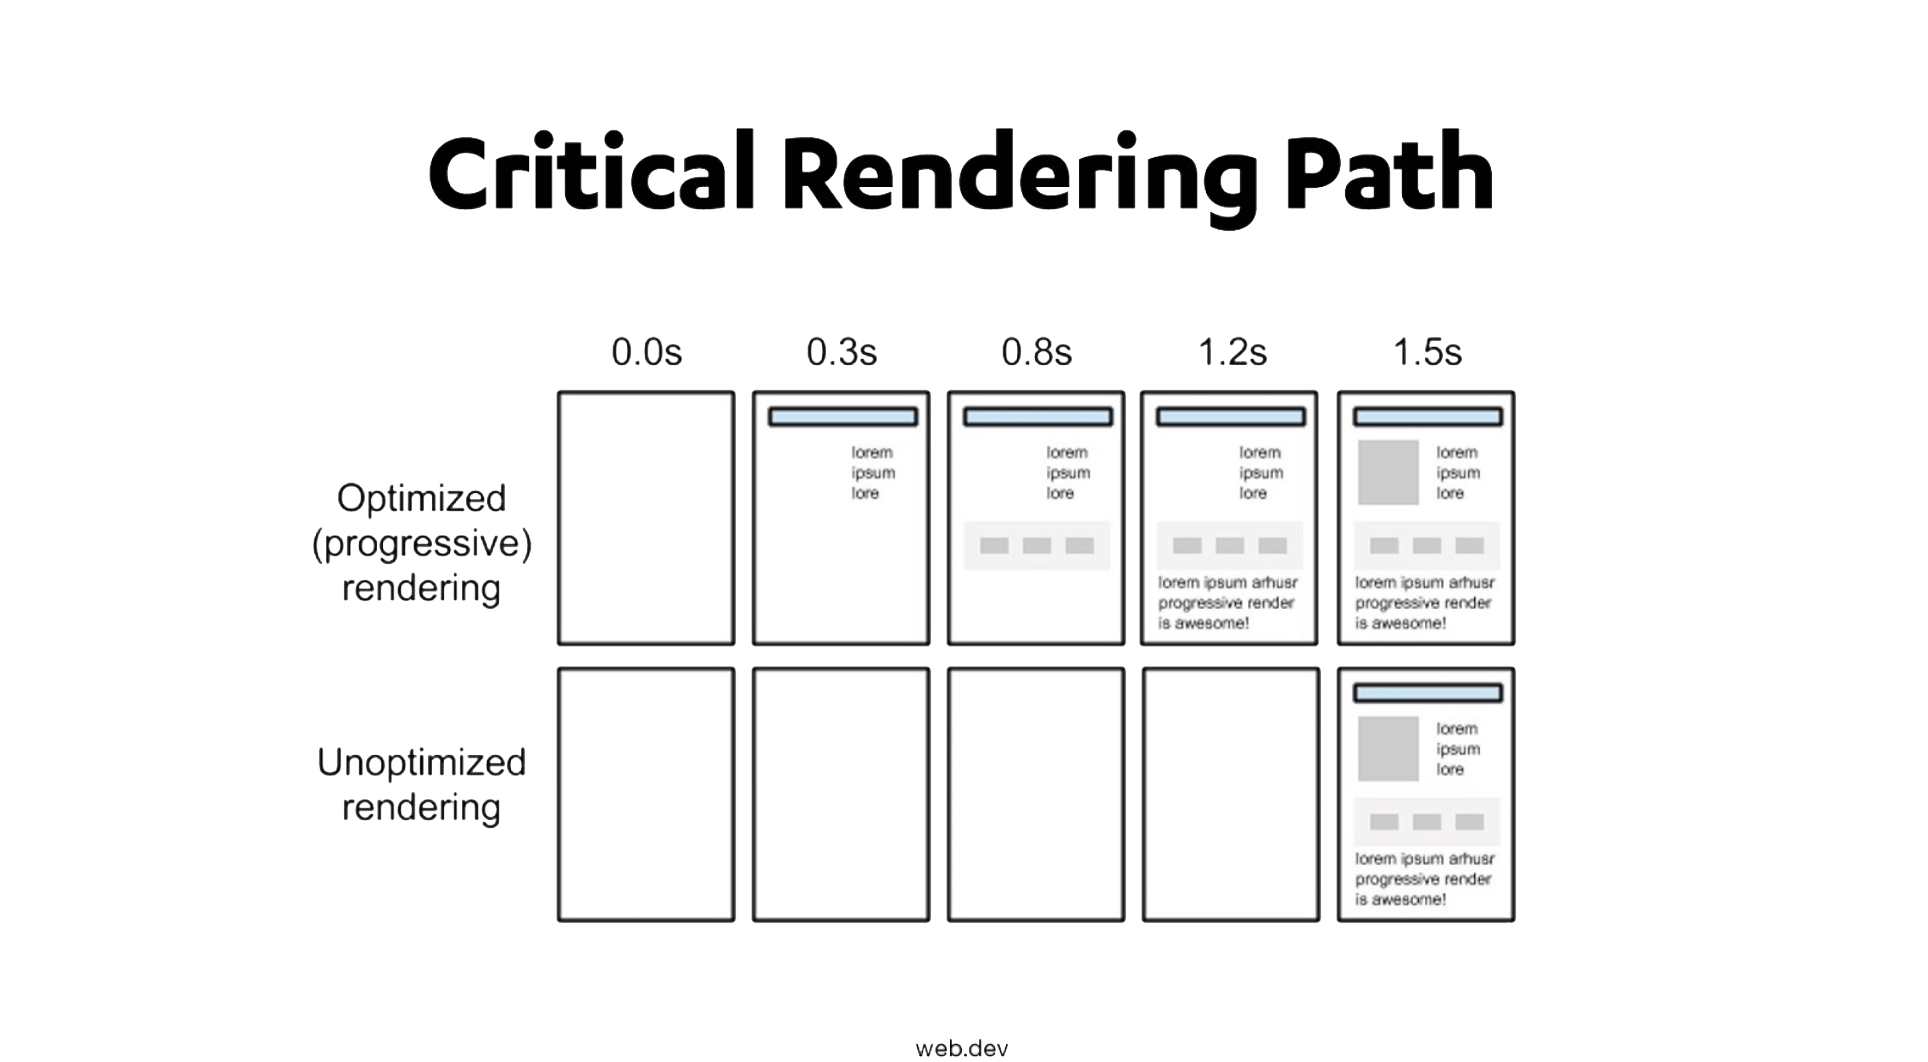
One thing both our talks had in common was our mentions of the critical rendering path. The critical rendering path is the set of steps a browser takes to convert all a page's resources – from images and HTML to CSS and JavaScript – into a complete, functional web page. Optimizing the critical rendering path means taking a good look at the order in which the resources on your pages render, and then making sure that each resource in the rendering path is as performant as possible. It sounds simple – and conceptually it is – yet it can be tricky to achieve (as this recent performance audit of LEGO.com reveals).
Easier to get help when you need it
One of the biggest challenges everyone seems to face these days is finding time to focus on keeping their sites fast. So we've recently expanded to include great consulting to go with our great tools.
Our team includes some of the most experienced people in our industry. People like Steve Souders, Andy Davies, Cliff Crocker, Mark Zeman, and me. We've started global conferences, written books, taught courses, run design agencies, and improved conversion rates for all the big brands. We care about making the web faster and we want to help you.

Learn more about our consulting services (including our KickStart and HealthCheck services), and contact us at support@speedcurve.com if you have any questions.
Looking ahead
"Make things easy (or at least easier)" continues to be our mantra. We want to make your web performance monitoring – not to mention your ability to fix performance issues – as easy as possible. If you have any feedback or suggestions, we'd love to hear it! Send us a note at support@speedcurve.com.
If you're not yet using SpeedCurve, we'd love to have you give us a try! Start your free trial.

Read Next

CI/CD workflow improvements, more powerful RUM, and more! Here's what we shipped this month.

Learn how to use our GitHub integration to fight regressions and keep your pages fast.