Navigate your way to better performance with prerendering and the bfcache

I was inspired by Tim Vereecke's excellent talk on noise-cancelling RUM at PerfNow this past November. In this talk, he highlighted a lot of the 'noise' that comes along with capturing RUM data. Tim's approach was to filter out the noise introduced by really fast response times that can be caused by leveraging the browser cache, prerendering, and other performance optimization techniques.
I thought Tim's focus on 'human viewable navigations' was a great approach to use when looking at how to improve user experience. But there also may be times when you want to understand and embrace the noise. Sometimes there are opportunities in the signals that we often forget are there.
In this post, I'll demonstrate how you can use SpeedCurve RUM to identify all types of navigations, their performance impact, and potential opportunities for delivering lightning-fast page speed to your users.
We'll cover things like:
- Understanding SPA navigations and performance
- Whether or not to track hidden pages (such as pages opened in background tabs)
- How to take advantage of prerendering and the back-forward cache (aka bfcache)
Understanding navigation types
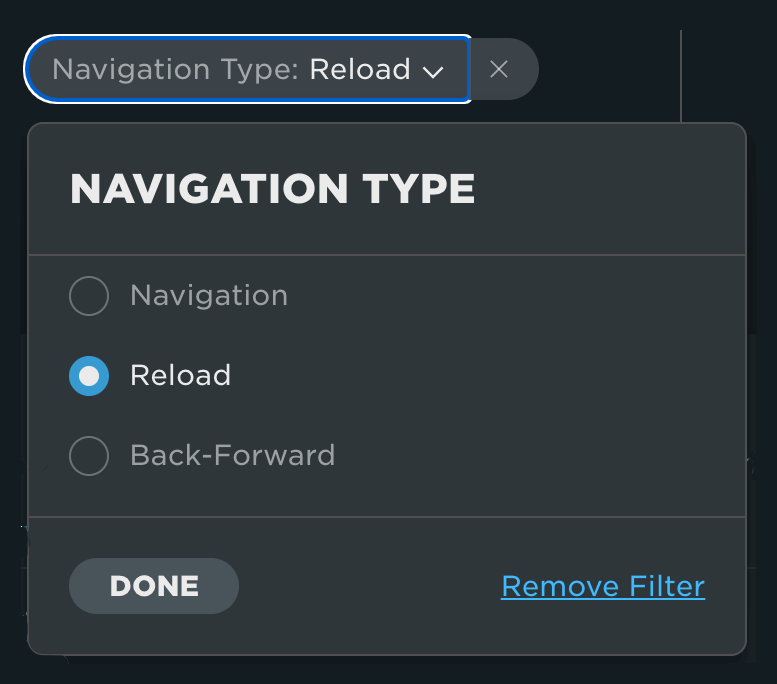
We've recently released a new filter in RUM that allows you to explore navigation types. You can find navigation types in the filters of your RUM and Favorites dashboards:
The different navigation types we track are:
Navigation – Full-page navigation
Reload – Page is reloaded from the browser history
Back-Forward Navigation – Page navigation using back/forward navigation (also known as bfcache navigation) controls
Other – All other navigations
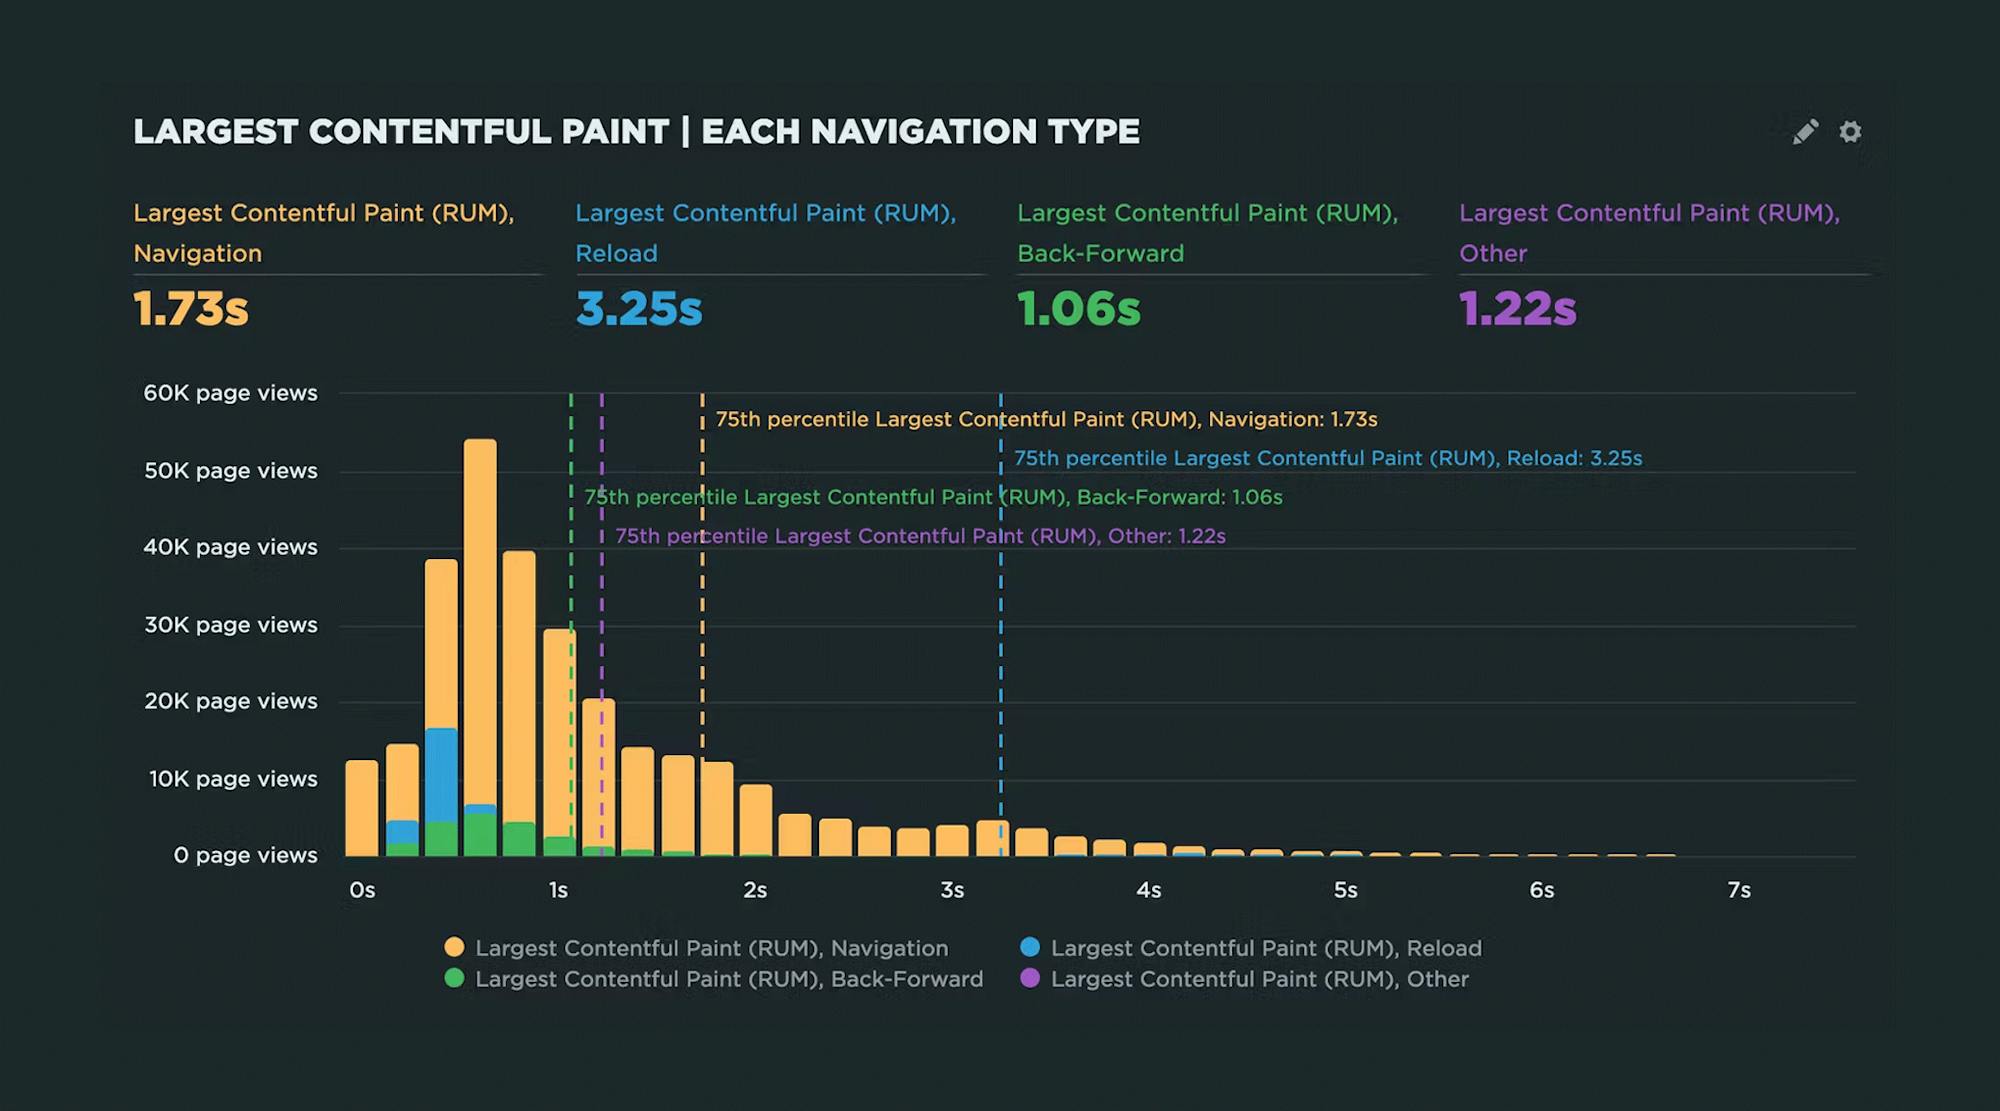
Not all navigations are created equal.
For example, full-page navigations have very different characteristics than bfcache navigations. It's helpful to see this in a histogram, where we can see the distribution for each navigation type for a metric such as Largest Contentful Paint (LCP):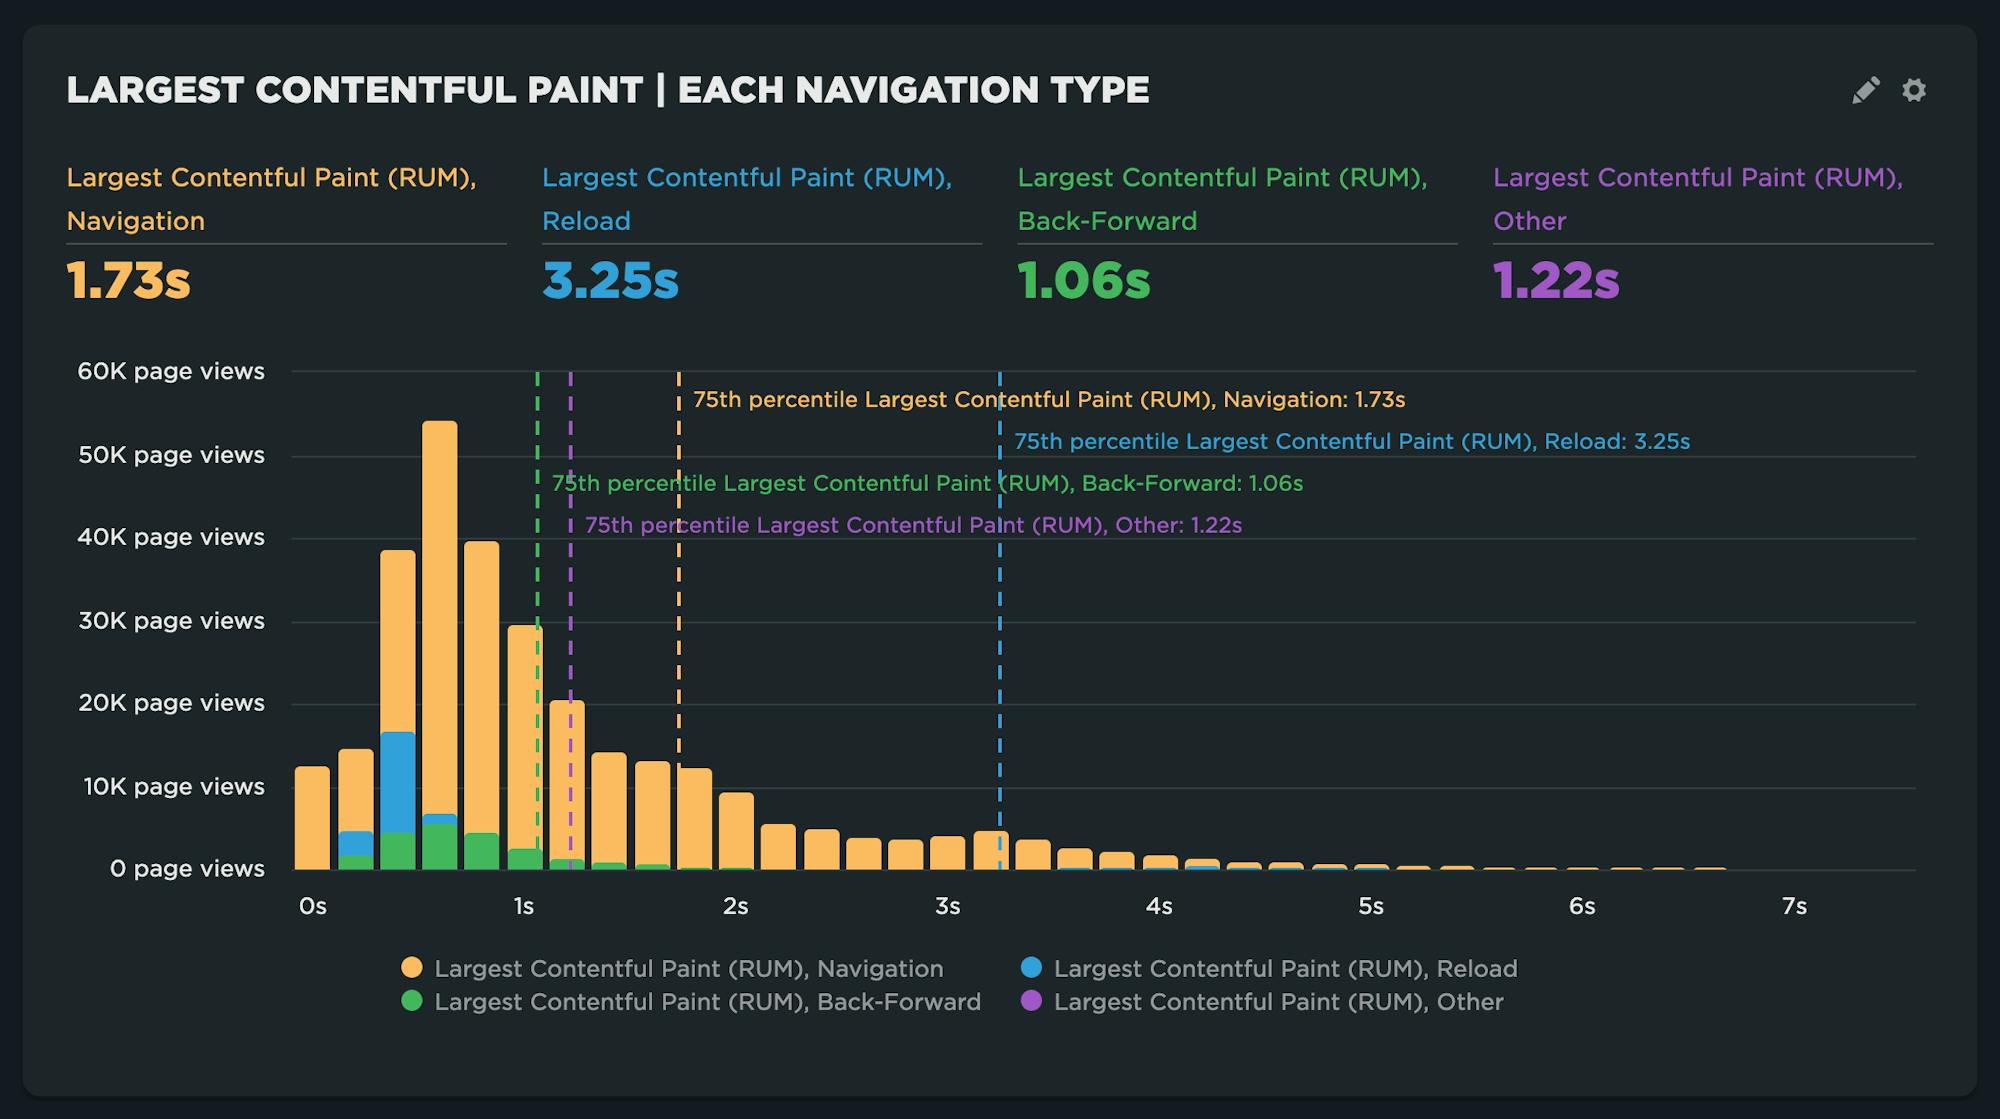
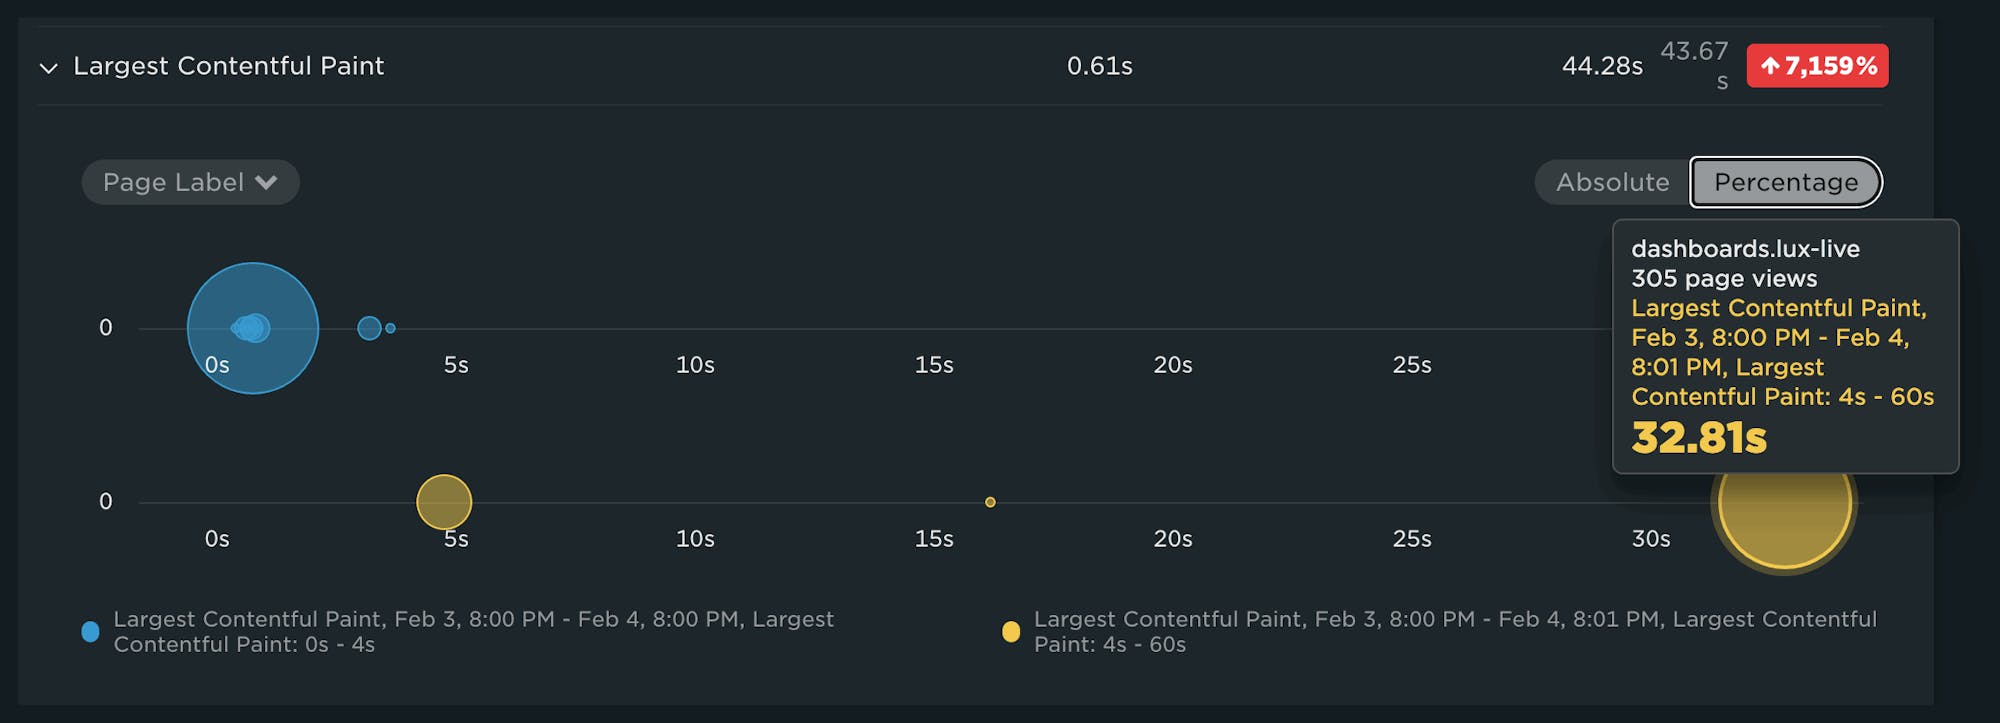
Understanding slow page reloads
In doing research for this post, I have to admit that I had an 'uh-oh' moment. Looking at the reloads from the previous chart on the surface was a bit of a head-scratcher:
How could LCP be so much slower on a reload versus a full-page navigation?
After a closer look at the histogram, I noticed there were a lot of reloads that happen to be slower in the long tail of the histogram:
When comparing the fast versus slow reloads, I found that these reloads were for our RUM Live dashboard. This dashboard forces a reload automatically. This was for a specific user who was loading the page on a very slow connection.
Lesson learned: Segmenting your pages in to cohorts is extremely helpful when exploring anomalies like this one.
Introducing Page Attributes
Another useful filter that we recently added is for something we refer to as Page Attributes. This goes a step further in explaining the different types of navigations – both visible and hidden from the end user.
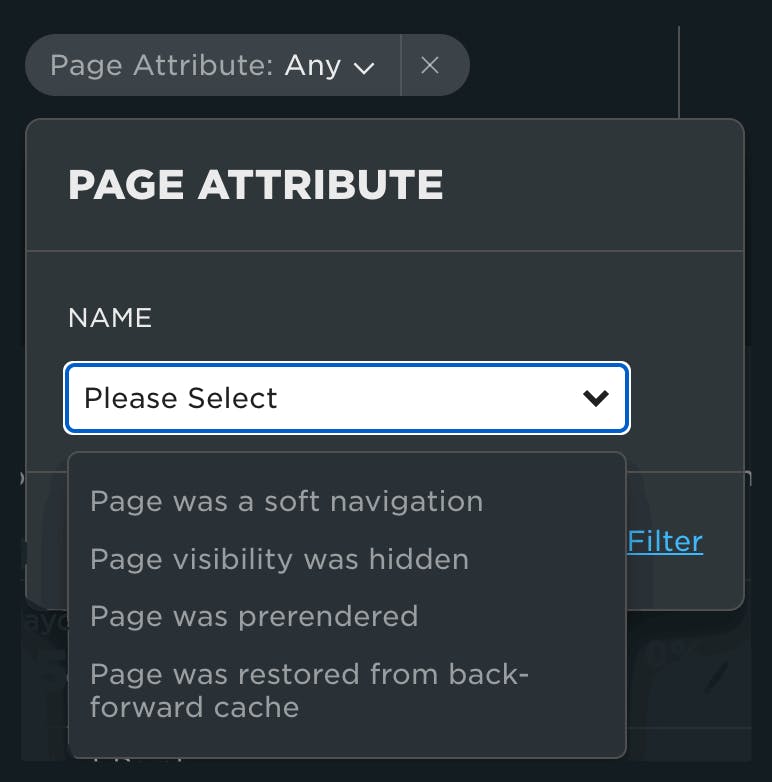
This is extremely useful when looking at pages that have unique performance characteristics including:
Page was a soft navigation – When implementing RUM for a SPA, you can use this attribute to compare initial page loads/hard navigations to SPA/soft navigations.
Page visibility was hidden* – For pages that are loaded in a hidden state, such as when you open a link in a background tab for viewing later, the performance can vary greatly given the browsers ability to mitigate resource consumption in an effort to preserve the user experience.
Page was prerendered – Prerendering can happen automagically in the browser or by using the Speculation Rules API . When this occurs, pages that are activated appear to load instantaneously and have unique characteristics compared to other types of navigations. For example, in SpeedCurve, prerendered pages will have a value of '0' for most metrics.
Page was restored from back-forward cache* – The bfcache essentially stores the full page in memory when navigating away from the page. This browser optimization has the effect of instantaneous page loads when a user is navigating back (or forward) to a previously viewed page.
*Important: Currently you need to opt-in for tracking of hidden pages and bfcache restores. This is an option in your advanced RUM settings.
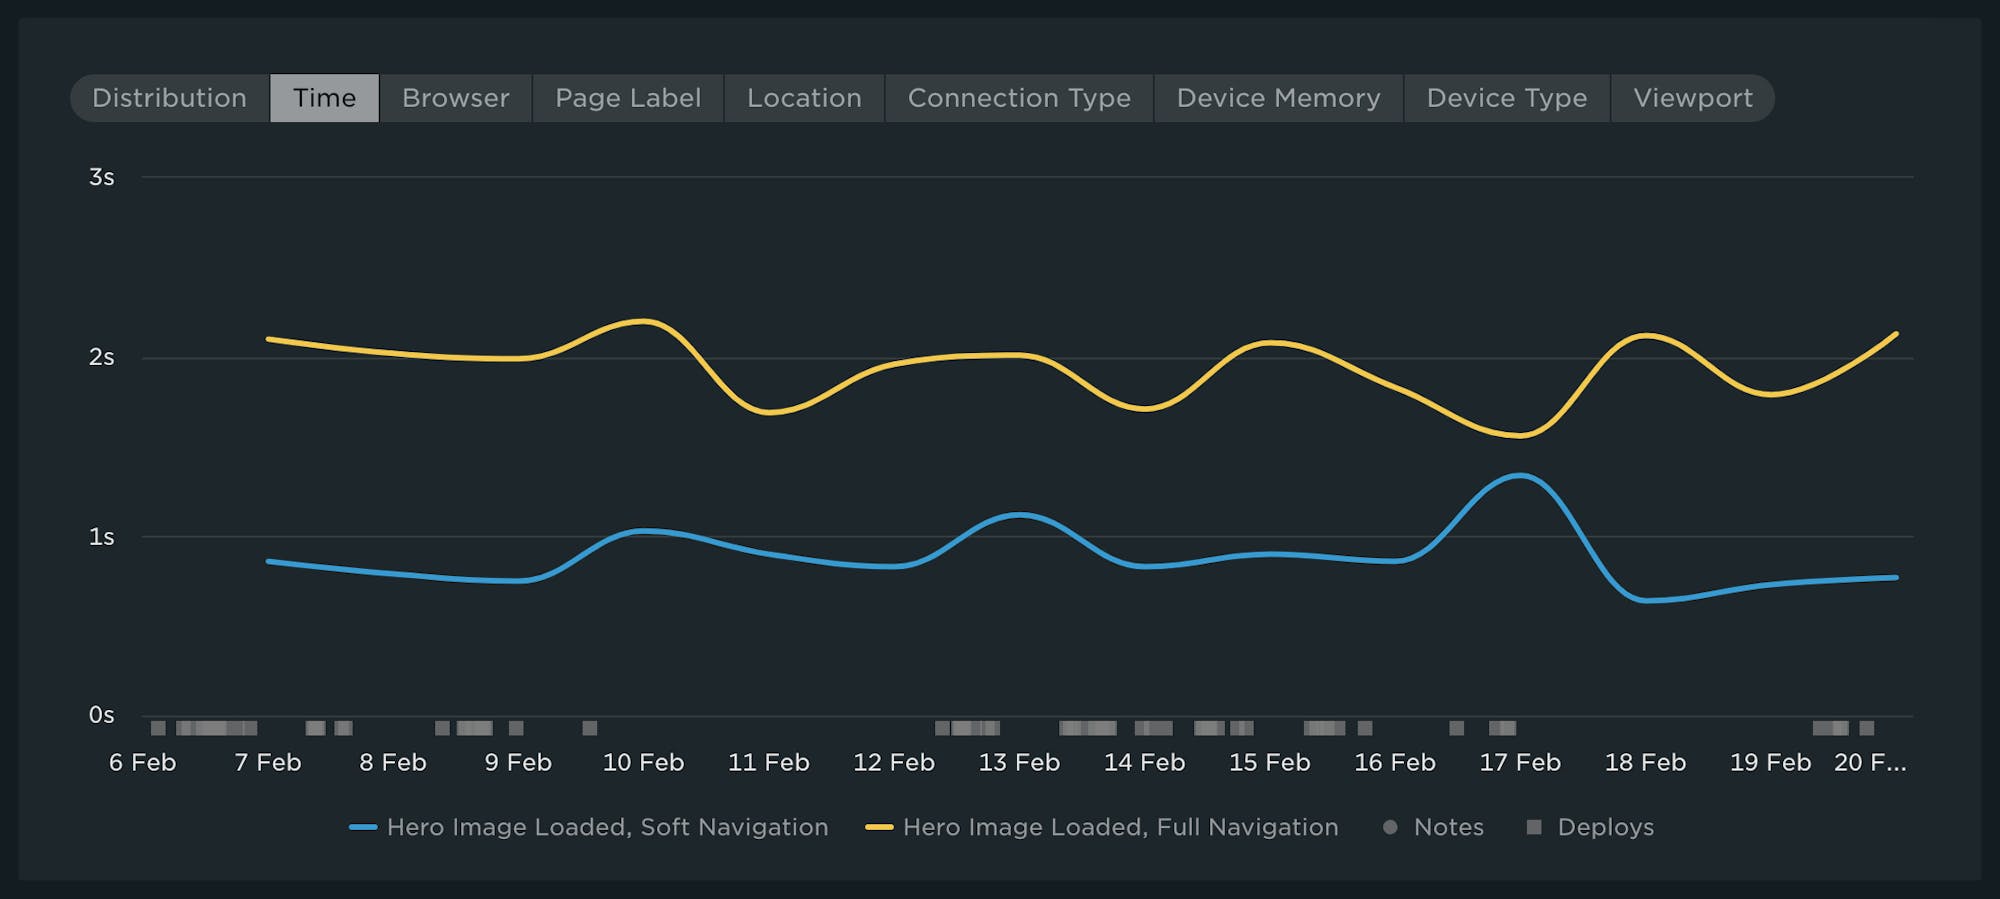
Understanding your SPA performance
Single-page application (SPA) performance can be hard to get your head around. The benefits of a SPA can sometimes be hindrances when you are trying to understand the user experience. In a SPA soft navigation (versus a full-page navigation), you don't always get the metrics you are looking for, such as render metrics like First Contentful Paint (FCP) and Largest Contentful Paint (LCP). Often you'll have to revert back to traditional timing metrics or those that are triggered by using custom metrics.
This custom metric comparison illustrates that performance characteristics can be drastically different between soft navigations and full-page navigations:
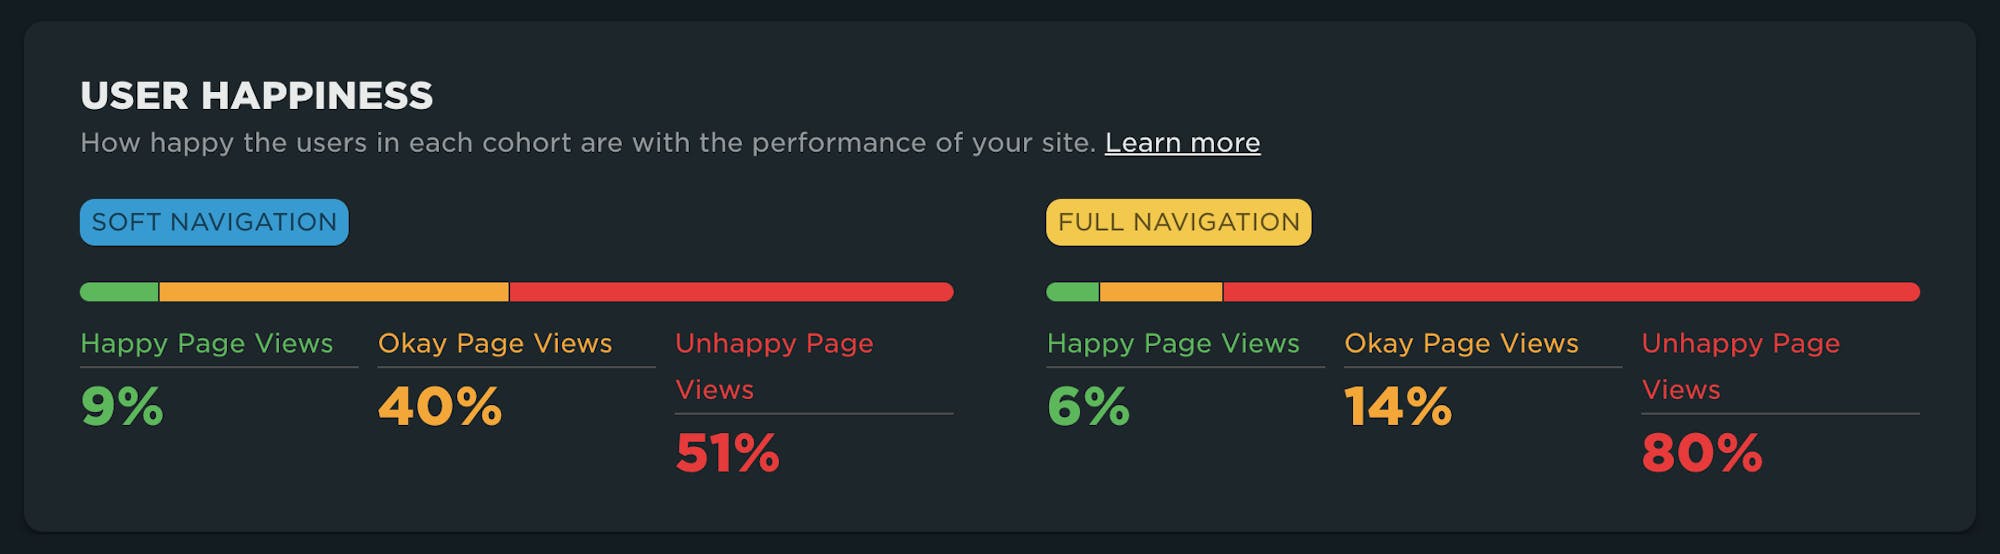
The differences between the full and soft SPA navigations can have a big impact on other derived metrics as well, such as user happiness:
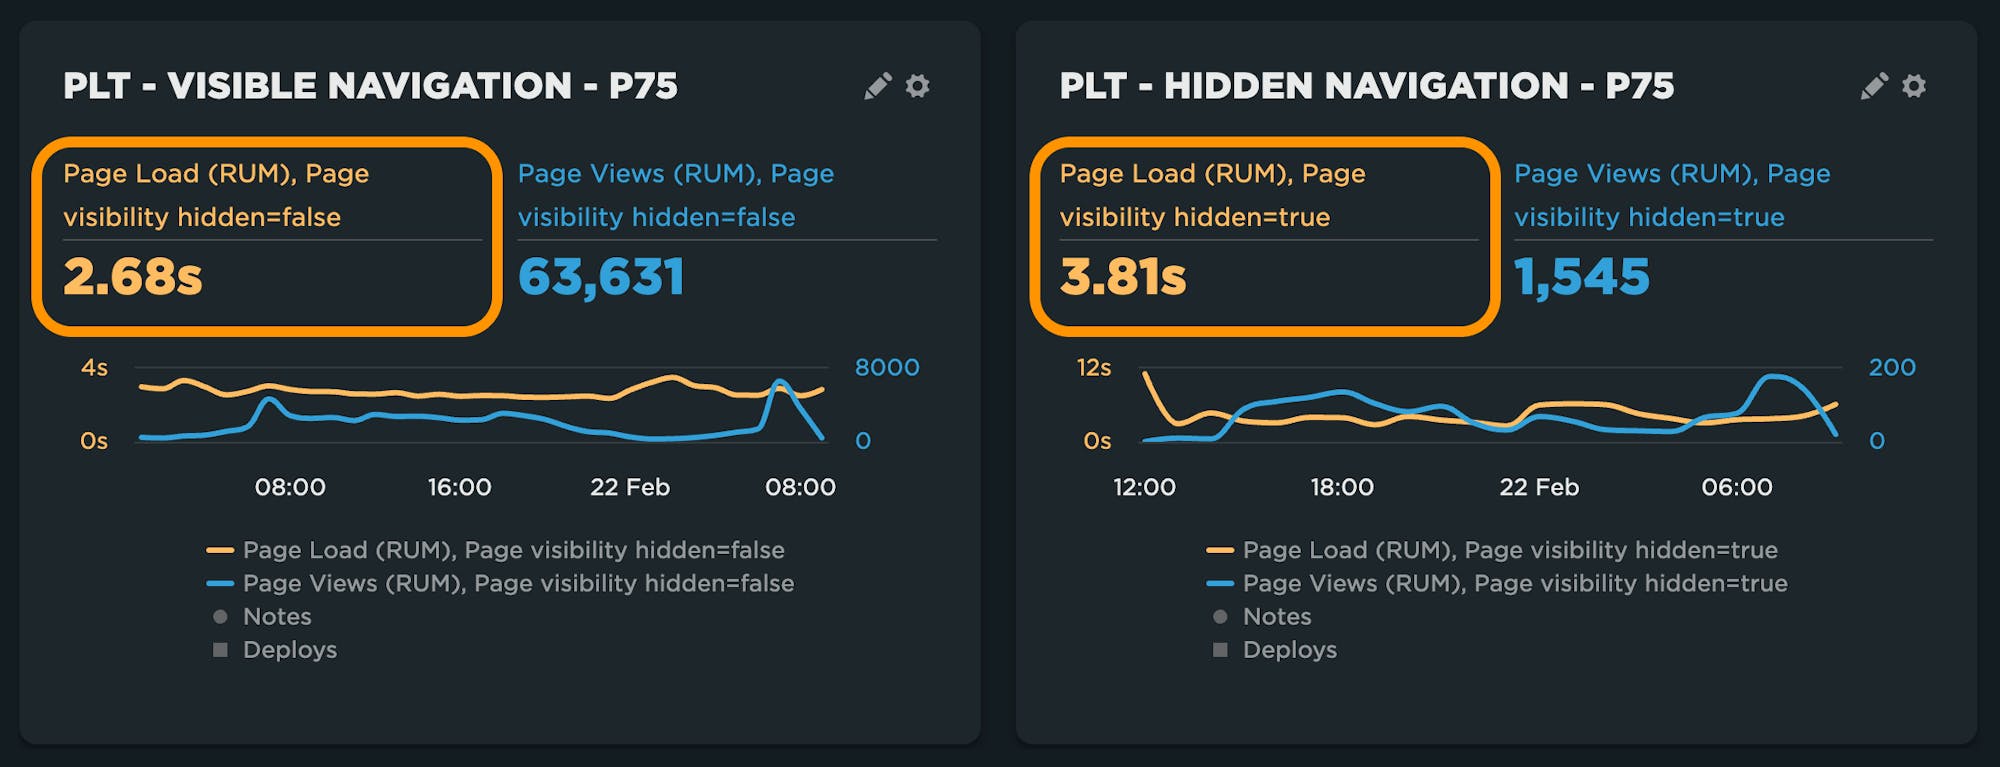
Hidden pages: To track or not to track?
If a tree falls in the forest, does anybody hear? By default, SpeedCurve does NOT track pages that are hidden from the user, such as a page opened in a background tab. However, you may want to understand if those pages are having issues.

Be warned that rendering of hidden pages is deprioritized by the browser when trying to conserve resources, which may or may not have something to do with your site. The charts below illustrate that, all things equal, hidden pages are more than a second slower to load than visible navigations.
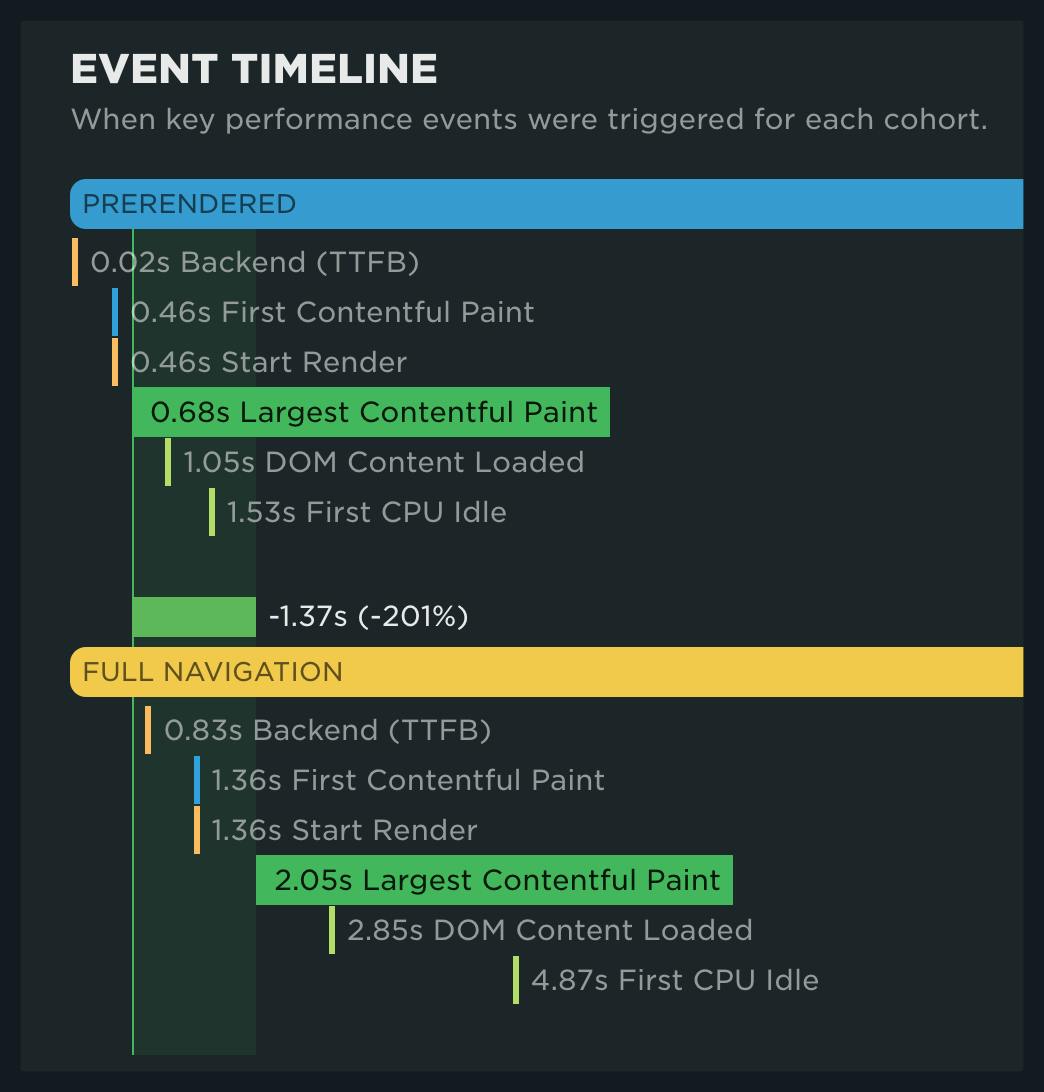
Take advantage of prerendering
Prerendering pages based on where you expect users to click next may sound a little creepy, but it sure does make your user experience a lot faster. In this example of product pages for a major online retailer, prerendered pages were 200% faster than full navigations:
What is this mysterious prerendering magic we speak of, and how do you take advantage of it? Prerendering has been around in Chrome for a little while, but just recently the Speculation Rules API was introduced, which supersedes the now deprecated <link rel="prerender">.
Using prerender json instructions within <script type="speculationrules">, browsers will prefetch and load the page into memory cache, making subsequent navigations appear instantaneous.
Chrome also uses prerendering for addresses typed into the omnibox for pages with a high confidence. The search bar may also leverage prerendering, depending on the provider.
Barry Pollard provides a comprehensive overview of the ins and outs of prerendering here.
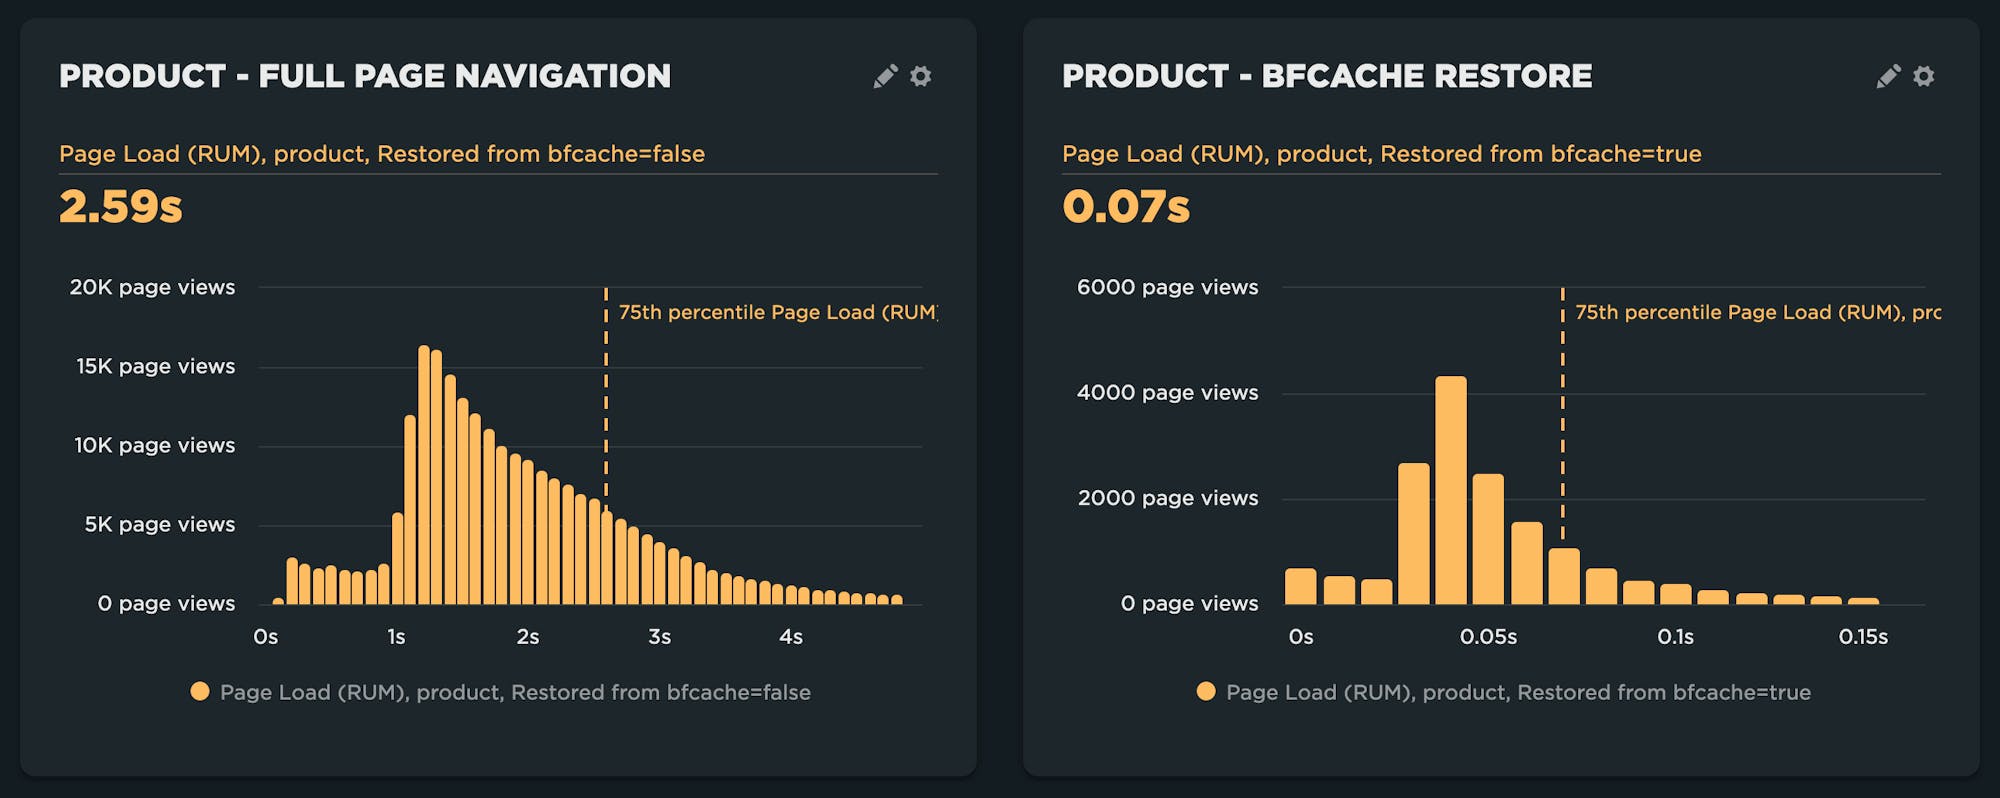
Putting the BF (blazing fast) in BFCache
Another notable cheat code for web performance is the use of the browser's bfcache, which essentially stores the fully rendered page in memory. Used in the aforementioned back/forward navigation, if the page is in the bfcache, you're in for another 'instant' page load.
Bfcache is available in all modern browsers. As shown here, the performance difference between a full-page navigation and a bfcache restore – 2.59 seconds versus 0.07 seconds – is pretty impressive!
If you are a Lighthouse user or familiar with the audits provided in SpeedCurve, you may have noticed the following audit as of Lighthouse 10: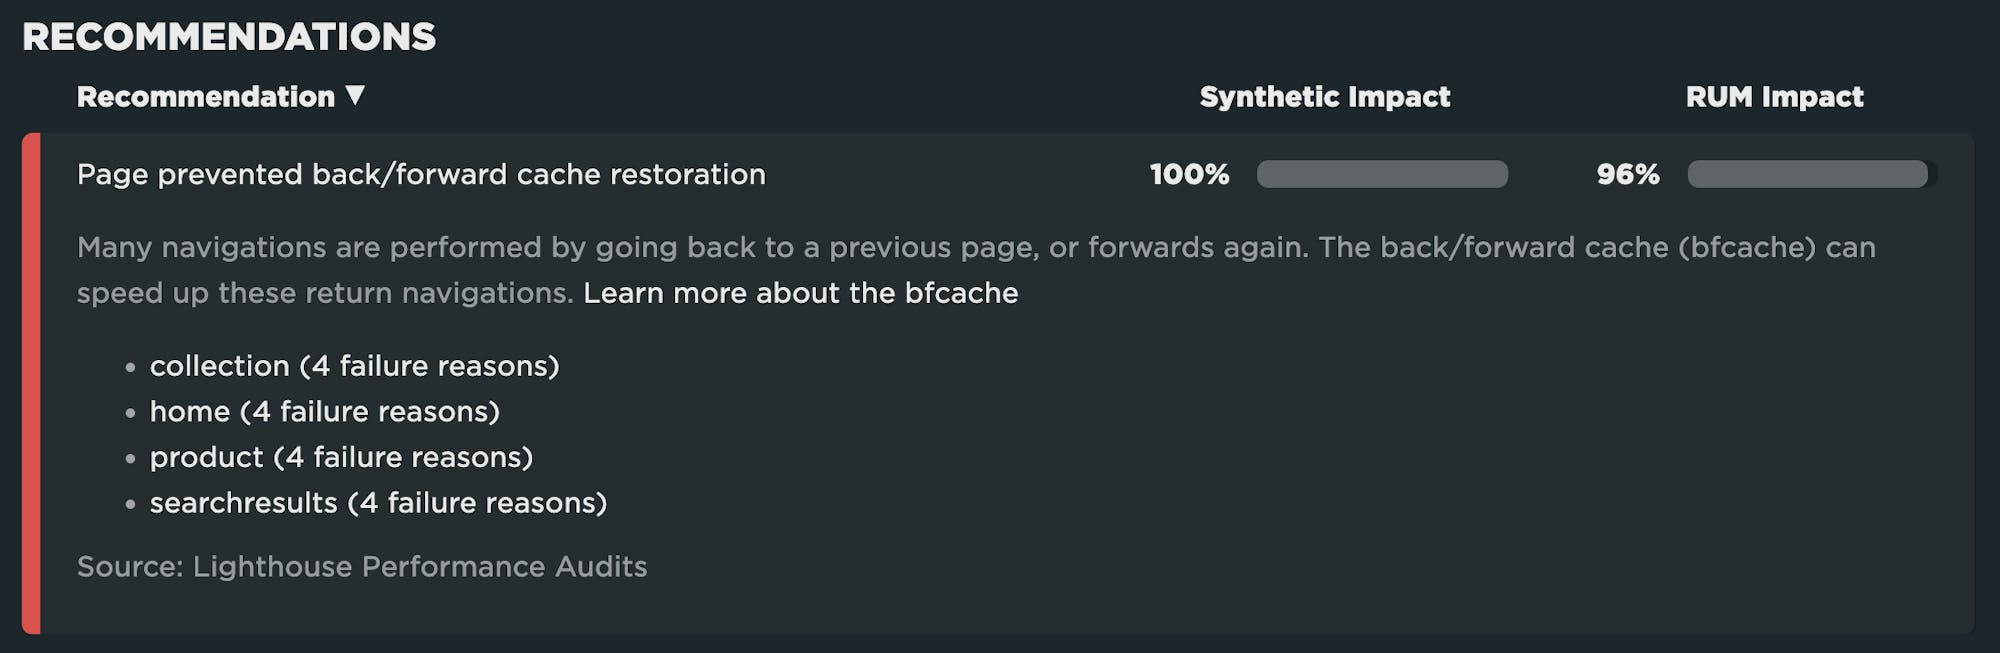
For Chrome, there are a number of reasons why a bfcache restore may fail. Some of them are within your control, while others are not. Here is a great resource for understanding how to optimize your pages for bfcache.
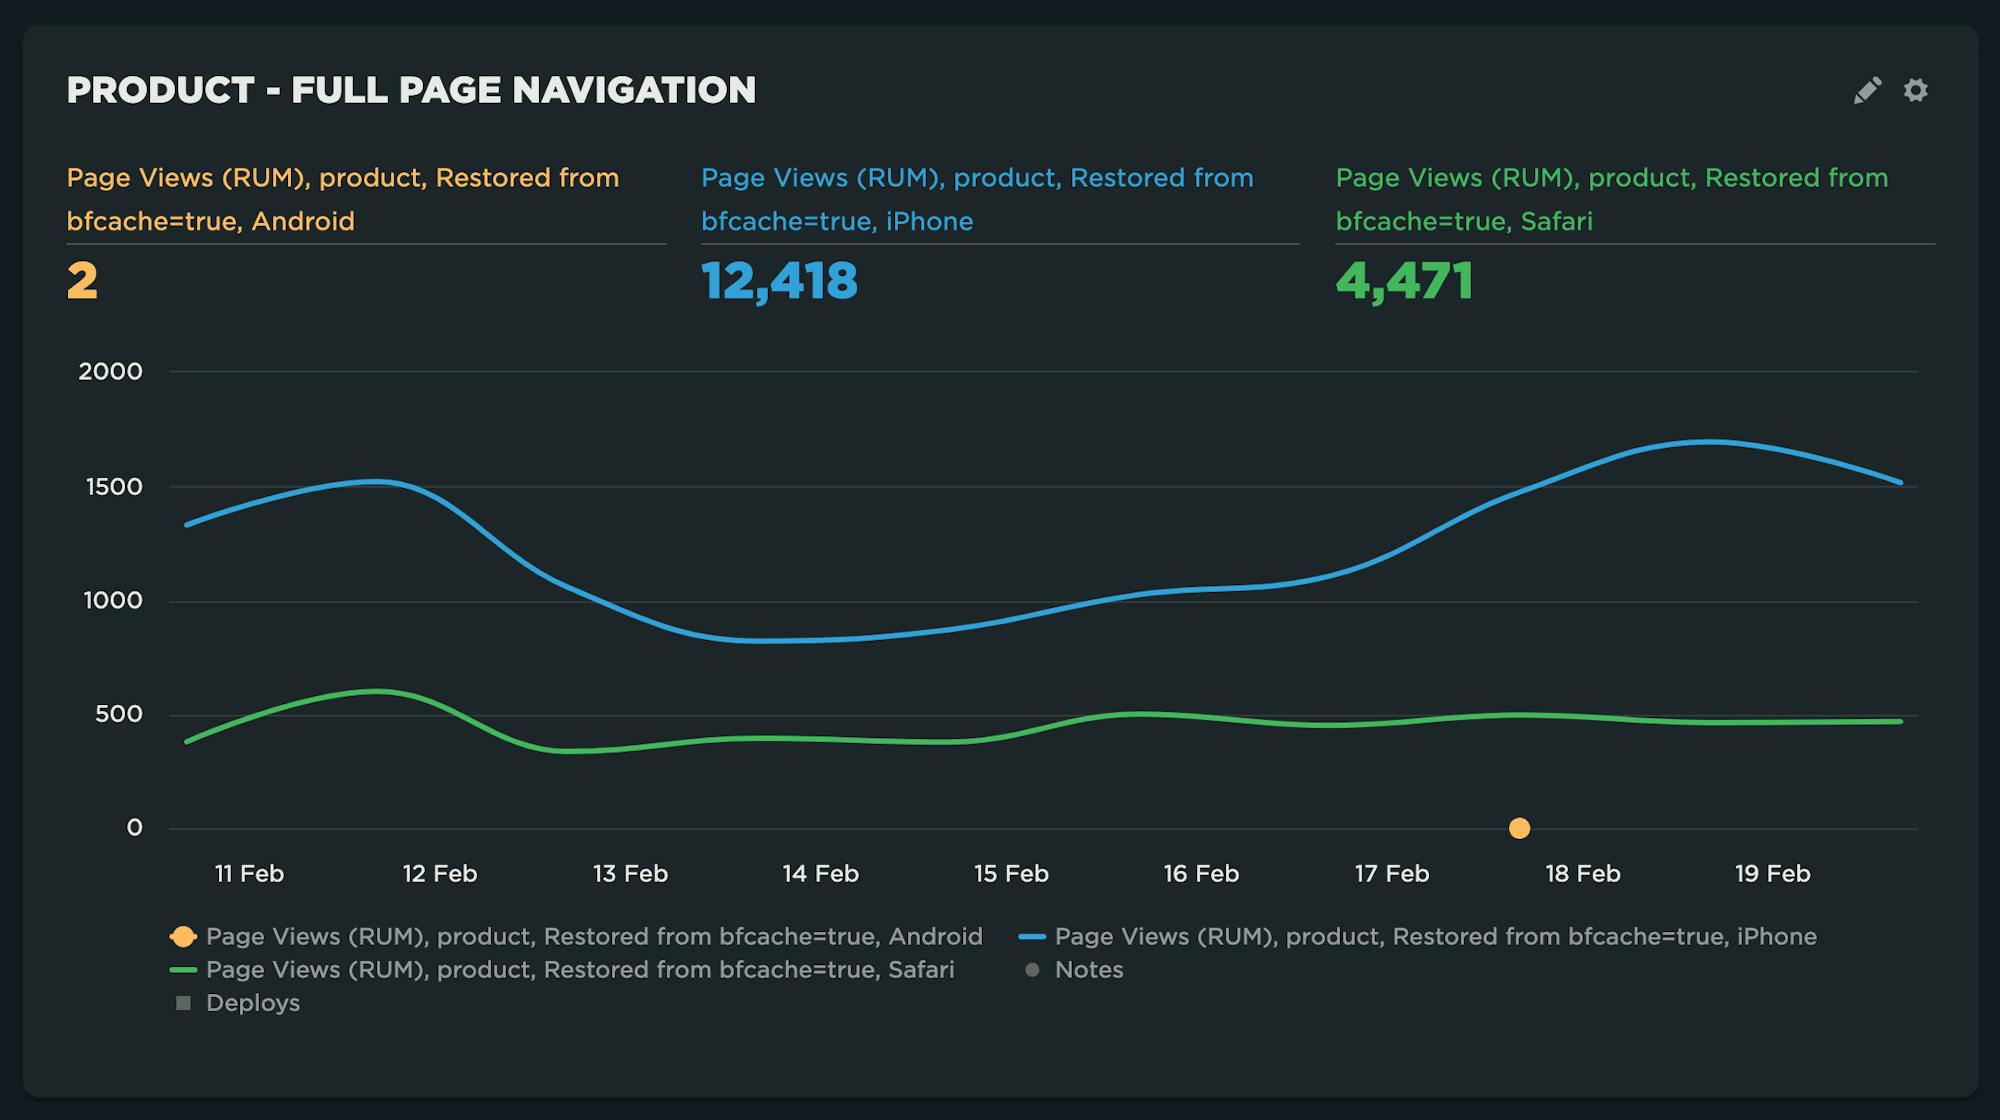
Important: The criteria for a page entering the bfcache is different between Chrome and other browsers. Safari has been leveraging bfcache for quite some time and appears to be far less restrictive.
For the same site listed above – which failed the bfcache audit – Safari (desktop and mobile) has a very large number of bfcache restores, while Chrome and Firefox are missing all together!
Get started
Low-hanging fruit tastes the best. While everything else you're doing to speed up your pages is by no means a wasted effort, understanding how to leverage the browser in a more effective way for repeated navigations is totally worth it!
If you're already using SpeedCurve RUM, then you can take advantage of all the insights described in this post. If you're not using our RUM yet, we'd love to have you try it! Sign up for your free trial and follow the steps in our welcome guide to get started.

Read Next

What is INP? How does it correlate with user behaviour, such as bounce and conversion rates? And how can you improve it?

Learn how to use our GitHub integration to fight regressions and keep your pages fast.