Hello INP! Here's everything you need to know about the newest Core Web Vital


After years of development and testing, Google has added Interaction to Next Paint (INP) to its trifecta of Core Web Vitals – the performance metrics that are a key ingredient in its search ranking algorithm. INP replaces First Input Delay (FID) as the Vitals responsiveness metric.
Not sure what INP means or why it matters? No worries – that's what this post is for. :)
- What is INP?
- Why has it replaced First Input Delay?
- How does INP correlate with user behaviour metrics, such as conversion rate?
- What you need to know about INP on mobile devices
- How to debug and optimize INP
And at the bottom of this post, we'll wrap thing up with some inspiring case studies from companies that have found that improving INP has improved sales, pageviews, and bounce rate.
Let's dive in!
What is Interaction to Next Paint?
"Chrome usage data shows that 90% of a user's time on a page is spent after it loads. Thus, careful measurement of responsiveness throughout the page lifecycle is important. This is what the INP metric assesses."
~Jeremy Wagner, Google
In other words, we need a reliable metric that helps us understand how a page's responsiveness (or lack thereof) during the entire time a user is on the page helps (or hurts) their experience.
When you interact with a page, you want the page to respond seamlessly. The longer the wait, the worse the user experience, as you start wondering if the page is broken and start anticipating a frustrating, laggy experience. (This frustration is hardwired, as you can learn in this post about the psychology of site speed and human happiness.)
This is where measuring Interaction to Next Paint can help. INP measures the time from when a user starts an interaction – such as a mouse click, touchscreen tap, or physical or onscreen key press – until the next frame is painted in the browser. The faster the INP time, the more seamless the interaction feels.
According to Google, an INP of 200 milliseconds or less is ideal. Having said that, you may wish to aim for a faster INP for your own pages, for reasons I'll go into further down in this post.

In this excellent post, Jeremy Wagner explains how Interaction to Next Paint is calculated and how Google's INP thresholds (pictured above) are determined.
Farewell, First Input Delay!
Before we go any further, you might find it interesting to learn a bit more about First Input Delay (FID), the interactivity metric that preceded INP in Core Web Vitals, and why it was deprecated.
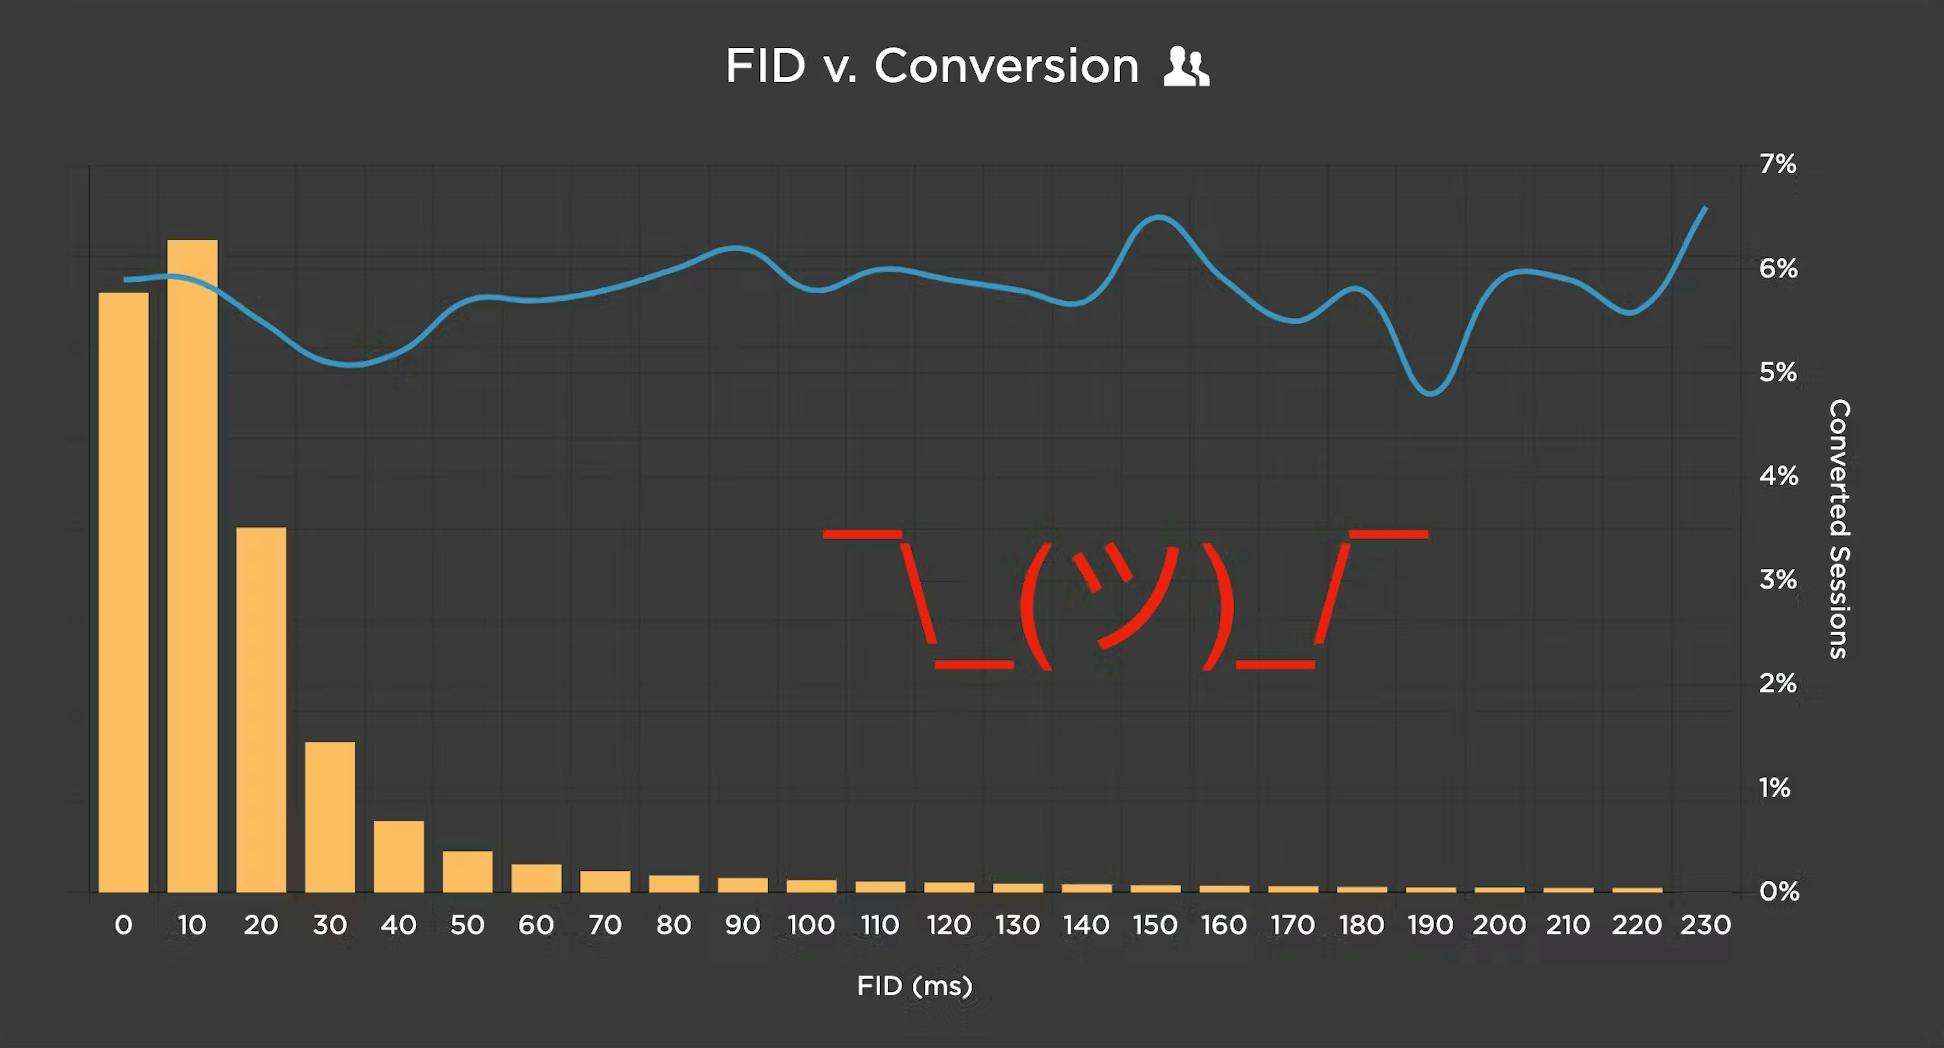
Here at SpeedCurve, we definitely get excited about emerging metrics. But we also approach each new metric with an analytical eye. Way back in 2020, Cliff Crocker took a closer look at First Input Delay and found that FID did not meaningfully correlate with actual user behaviour.
Does INP correlate to user behaviour?
The point of measuring responsiveness is because unresponsiveness hurts the user experience – which ultimately hurts your business metrics, such as bounce rate and conversions. If this is true, then we should be able to draw a direct line between Interaction to Next Paint and business metrics.
This is where correlation charts come in super handy.
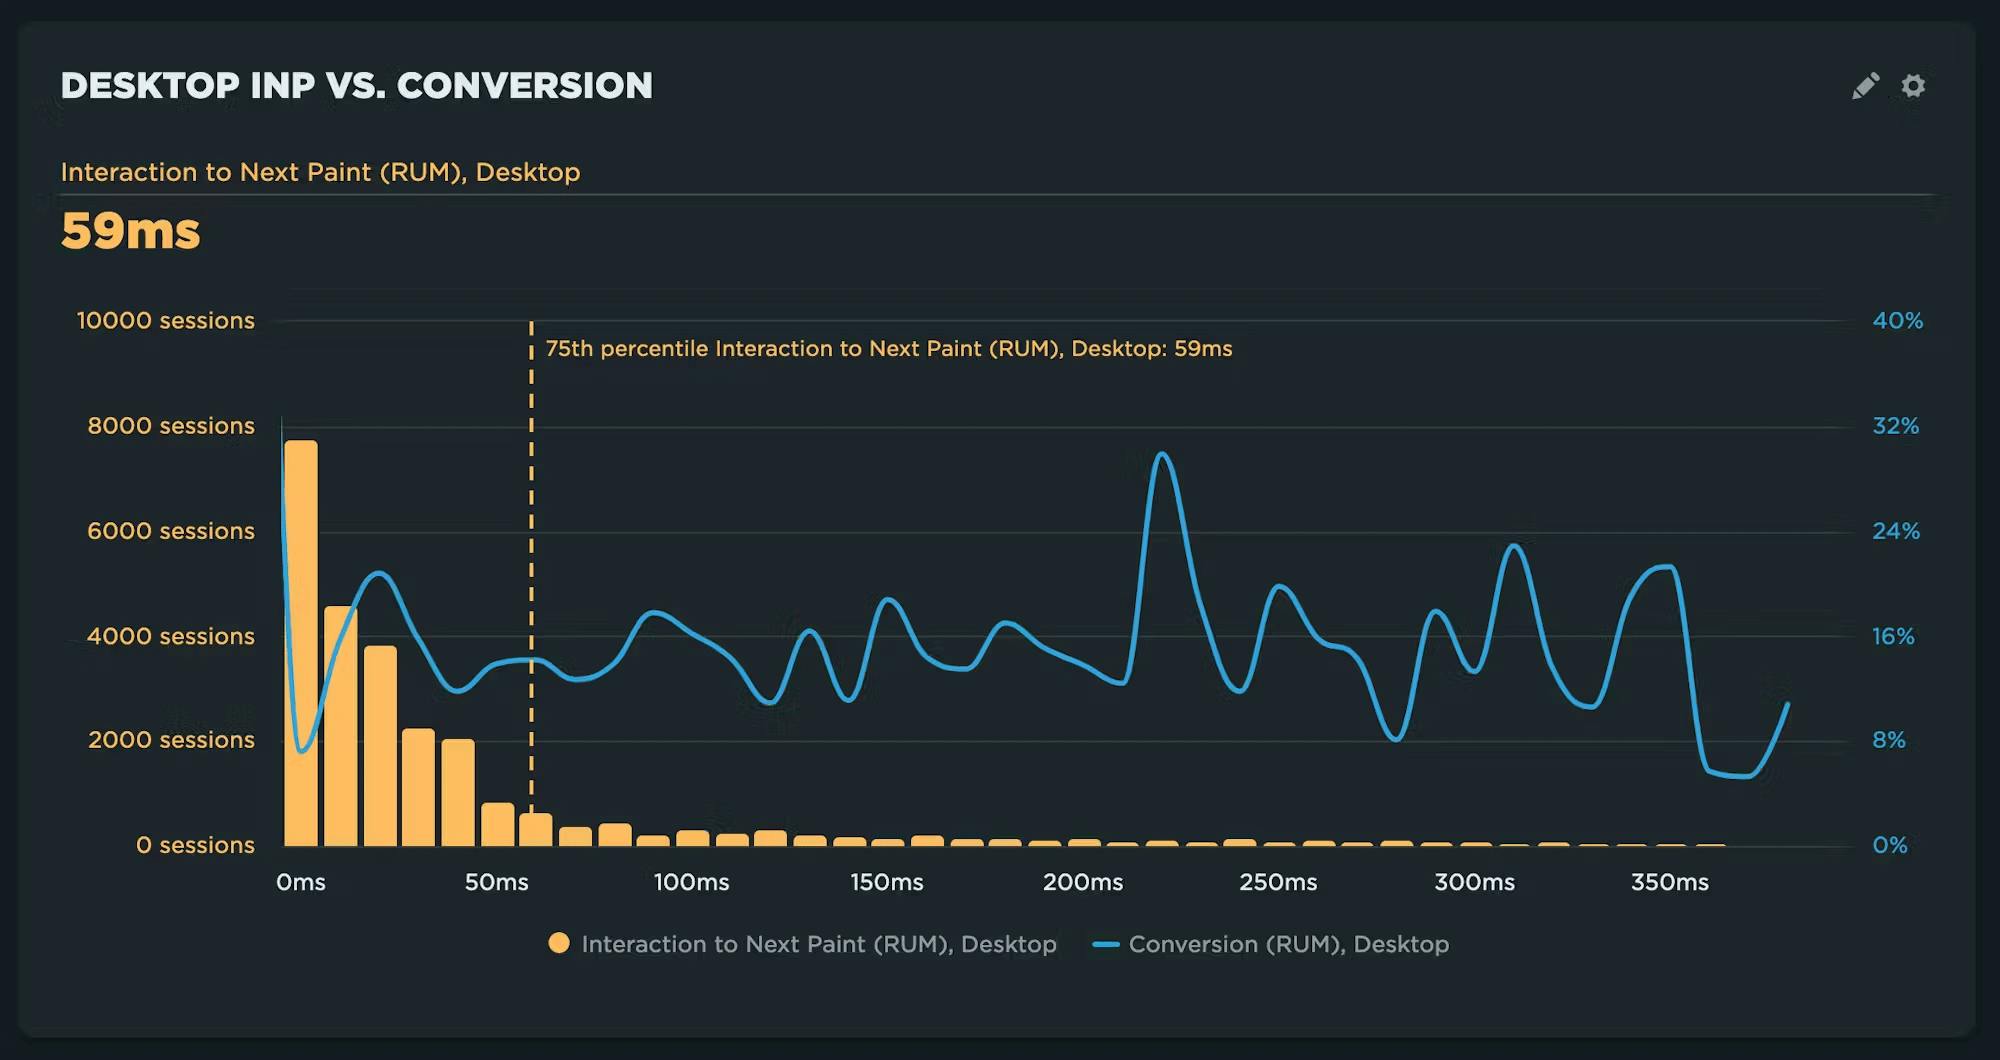
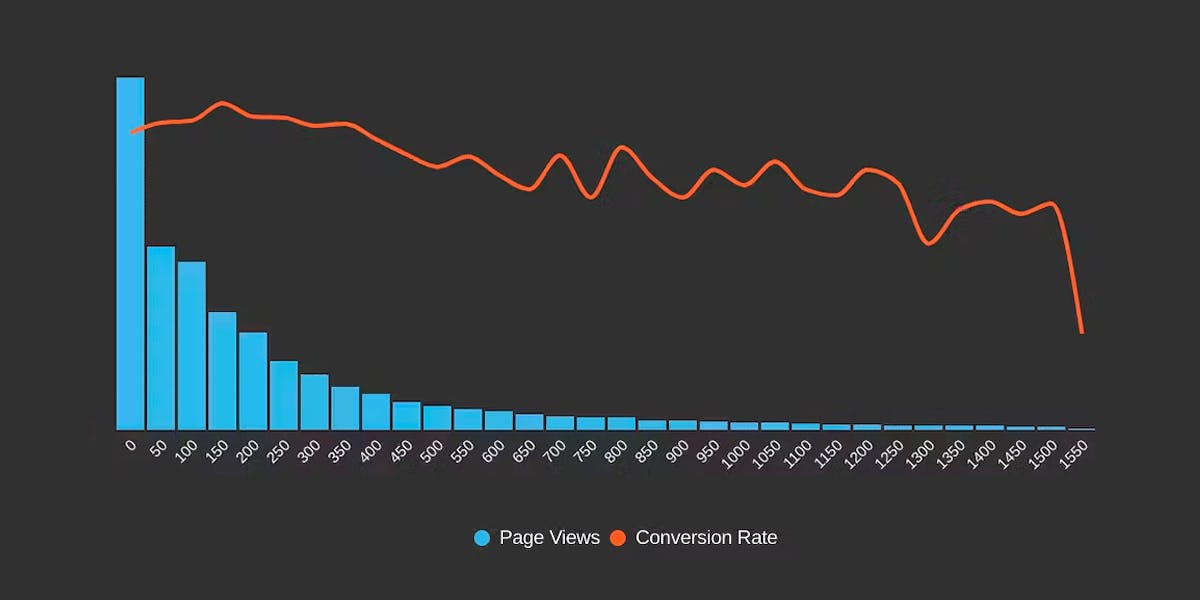
Correlation charts give you a histogram view of all your user traffic, broken out into cohorts based on performance metrics such as INP. The chart also includes an overlay that shows you a user engagement metric or business metric – such as bounce rate or conversion rate – that correlates to each of these cohorts. This lets you see at a glance the relationship between performance, user engagement, and your business.
A few months ago, Cliff Crocker turned his attention to analyzing INP. In his exploration of INP's correlation to conversion rate for a handful of different sites, Cliff found that yes, there typically is a correlation: when INP gets worse, conversions suffer.
However, Cliff also made the following observations:
- Results vary across sites – Not surprisingly, the impact is different based on the slope of the conversion line, as well as the distribution of INP across user sessions.
- There is no consistent correlation with Google's thresholds for 'Good', 'Needs Improvement', and 'Poor'. This is a hugely important observation. As Cliff states: "For one site, conversions suffer when INP is 100ms – well within Google's 'good' parameter of 200ms. This doesn't mean it's a bad idea to have a general set of thresholds. It just means those thresholds might not apply to your site. You must look at your own data."
Mobile INP is really important!
After further analysis, Cliff discovered still more important INP insights, including:
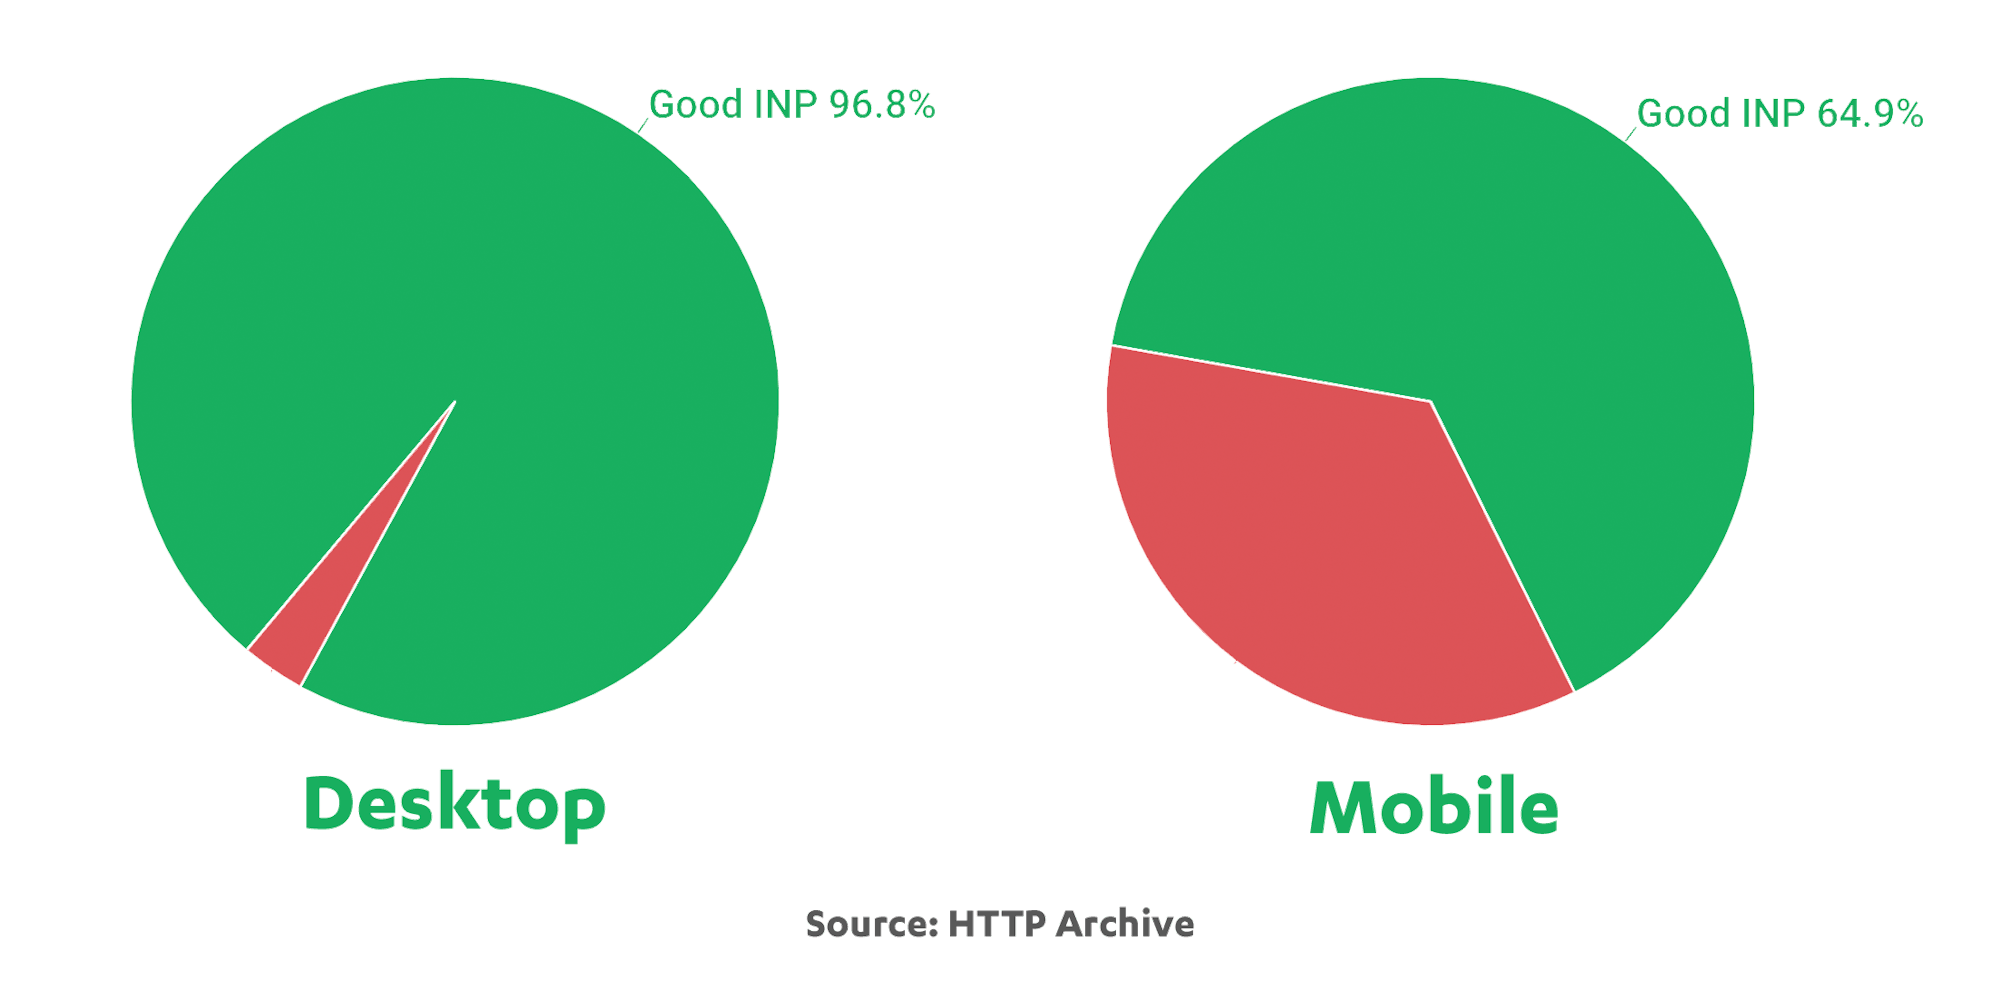
1. Only two-thirds of mobile sites have 'good' INP
Looking at data from the HTTP Archive, which tracks performance metrics for the top million sites on the web, the percentage of sites that have good INP is 96.8% for desktop, but only 64.9% for mobile. One of the biggest culprits: latency, which is typically worse on mobile.
2. Mobile INP = Android INP
This is due to the lack of Safari support for INP (among other performance metrics). If a significant number of your users are coming to you from Safari, you need to track a different responsiveness metric.
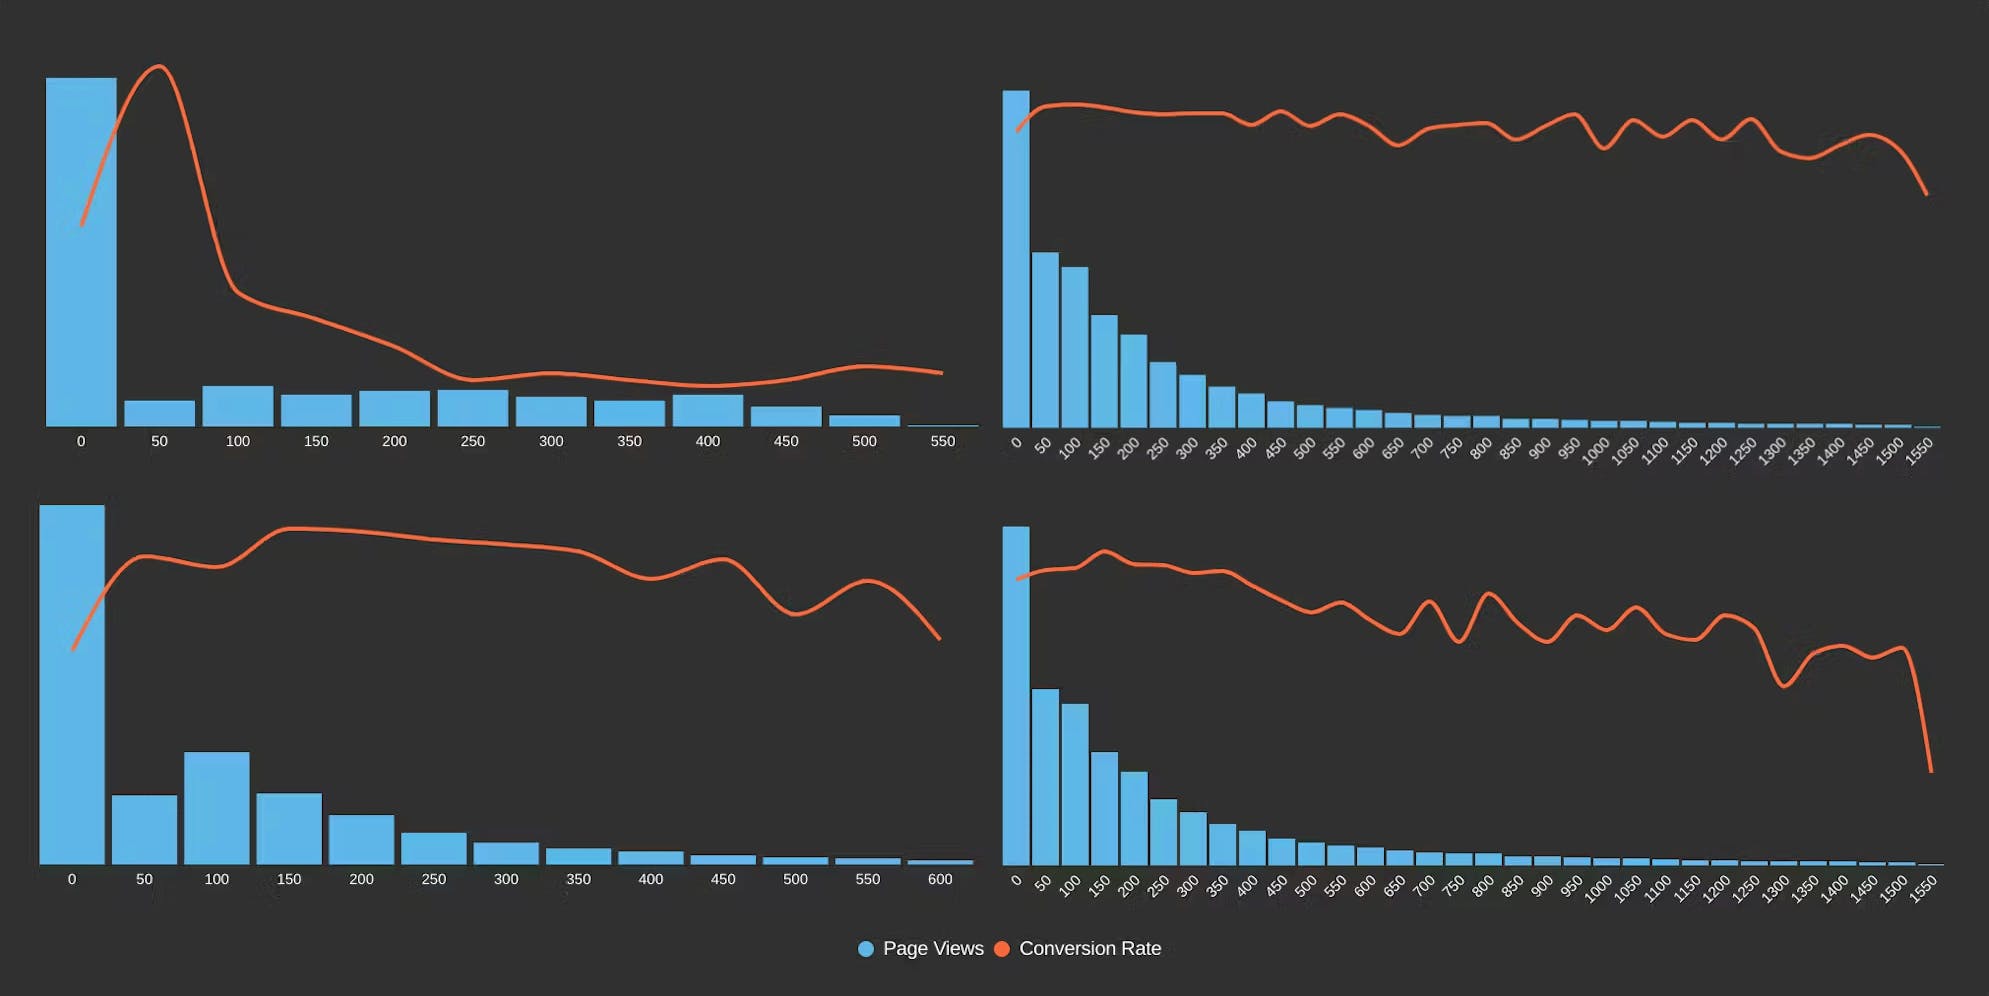
 3. Mobile INP has an even stronger correlation with bounce rate and conversions than desktop INP
You can see this in the charts below. Ignoring mobile responsiveness isn't something most of us can afford to do.
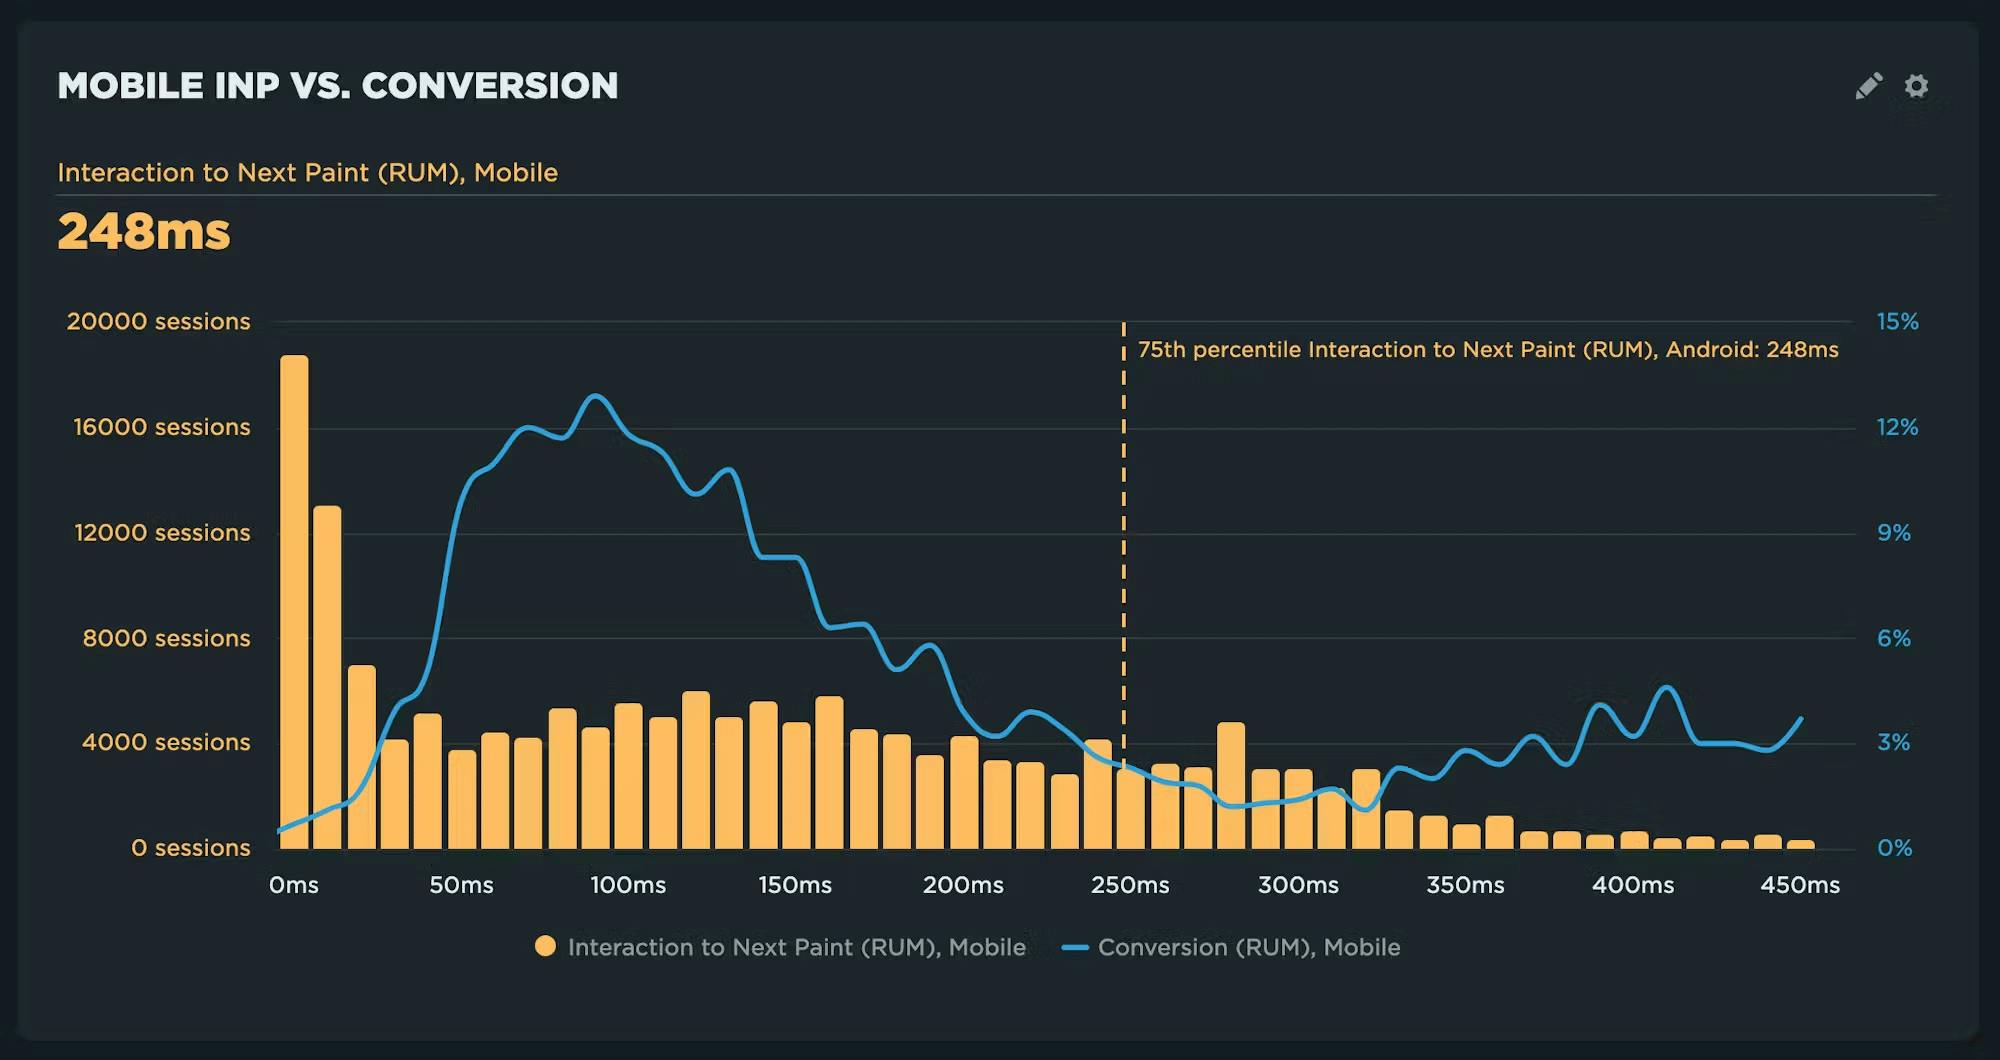
One of the many important takeaways from this post is that responsiveness on mobile is absolutely crucial to business and UX metrics. But if you're focusing on just INP to measure responsiveness, you're only getting insights into mobile performance for just one cohort of your users.
How to debug and optimize INP
Now that you understand how slow INP hurts your users and your business, let's talk about solutions. In this in-depth post, Andy Davies walks through what INP is, how to identify and debug slow interactions, and some approaches he's used to improve them.
"Many sites tend to be in the 'Needs Improvement' or 'Poor' category. My experience over the last few months is that getting to 'Good' (under 200ms) is achievable, but it's not always easy."
In his very detailed and comprehensive post, Andy walks through:
- How he helps people identify the causes of poor INP times
- Examples of some of the most common issues
- Approaches he's used to help sites improve their INP
INP case studies
The best way to understand the importance of optimizing INP is to look at your own RUM data for your own site. The second-best way is to look at case studies from other companies that have had success. Here's a handful for you to check out:
- Trendyol reduced INP by 50%, resulting in a 1% increase in click-through rate
- redBus improved INP and increased sales by 7%
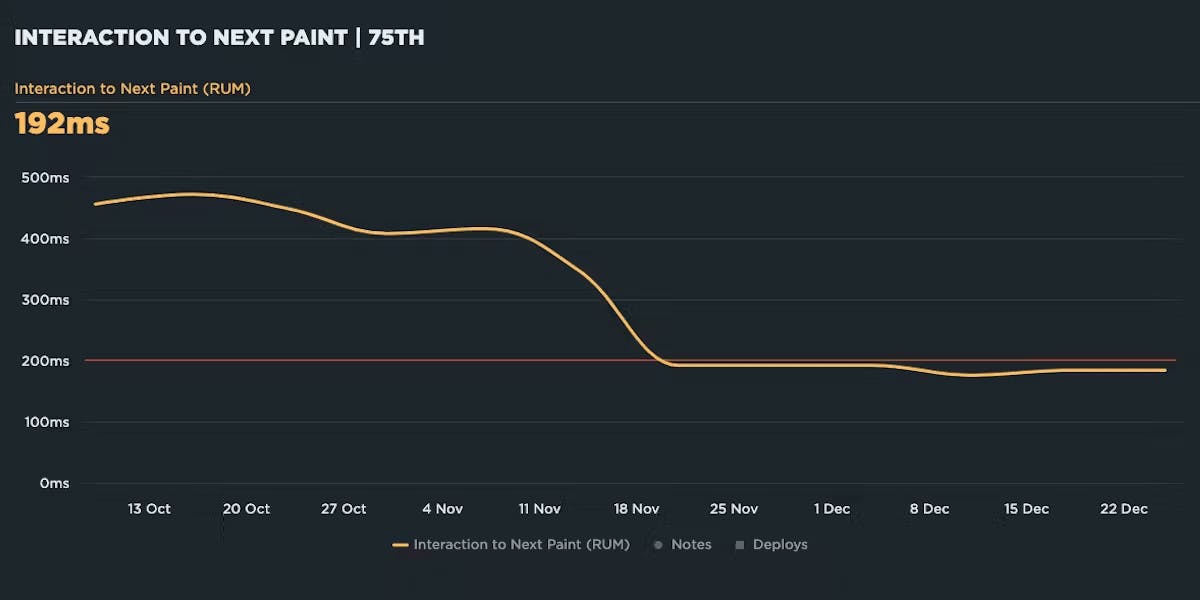
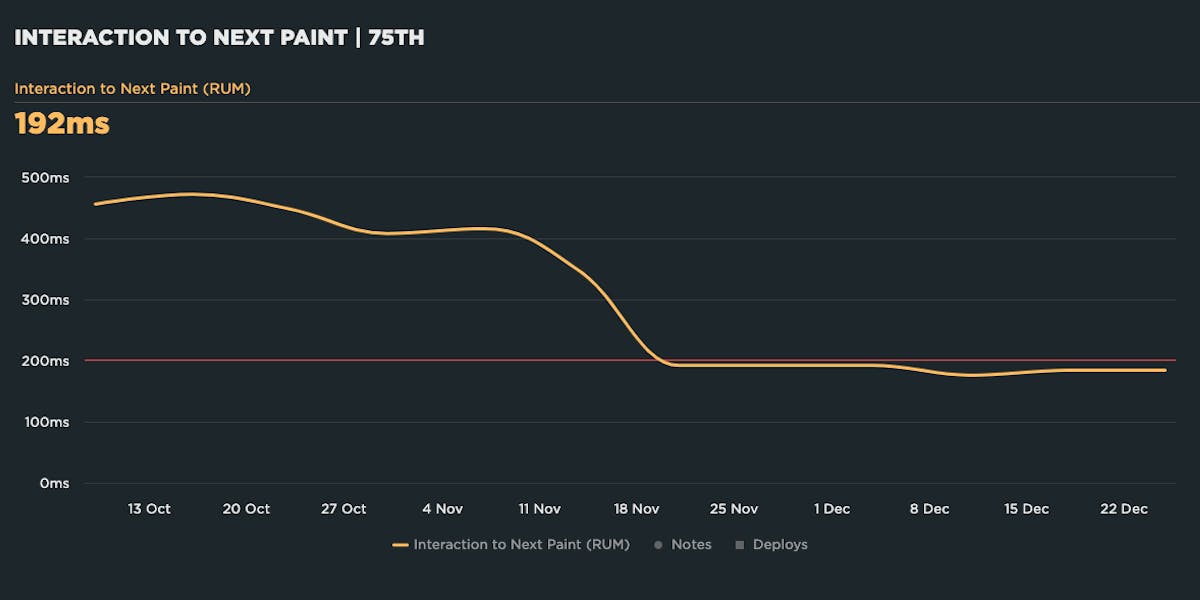
- The Economic Times reduced INP from 1s to 257ms, leading to a 50% decrease in bounce rate and 43% increase in pageviews
Takeaways
1. You definitely should be monitoring Interaction to Next Paint for your site, ideally using real user monitoring as the best source of truth.
2. You may find it helpful to create correlation charts to validate INP as a meaningful business-related metric.
3. When you create correlation charts, take careful note of when your business metrics start to suffer. Even though Google's recommended 'Good' INP threshold is 200 milliseconds, good INP for your own site may be higher or lower than that.
4. Look at INP separately for mobile and desktop. Your numbers could be quite different. You may also find that INP correlated to business metrics differently in each environment.
5. Think beyond INP. This is crucial if you have a lot of users coming to your site from different browsers. Remember that INP is only supported in Chrome-based browsers.
How to monitor INP in SpeedCurve
If you're not already using our RUM to monitor INP alongside your other important metrics, we'd love to have you give us a try!
- Start your free 30-day trial
- Follow our handy guide to enabling RUM
- Create your Core Web Vitals dashboard (it's easy!) so you can get alerts when any of your metrics start to suffer
- Contact us at support@speedcurve.com with questions or feedback

Read Next
Learn what INP is, how to identify and debug slow interactions... and most important, how to make them faster!
If you make INP faster, will it actually improve the user experience... and help your business? Here's our analysis.