NEW: RUM attribution and subparts for Interaction to Next Paint!

Our newest release continues our theme of making your RUM data even more actionable. In addition to advanced settings, navigation types, and page attributes, we've just released more diagnostic detail for the latest flavor in Core Web Vitals: Interaction to Next Paint (INP).
This post covers:
- Element attribution for INP
- A breakdown of where time is spent within INP, leveraging subparts
- How to use this information to find and fix INP issues
- A look ahead at RUM diagnostics at SpeedCurve
How quickly does my site respond to user input?
In short, Interaction to Next Paint measures the responsiveness of your pages. (If you want to dive deeper, check out our INP primer.) Delays in responsiveness can lead to user frustration, which affects user engagement, which in turn affects your business objectives, such as revenue. This is why you should care about INP.
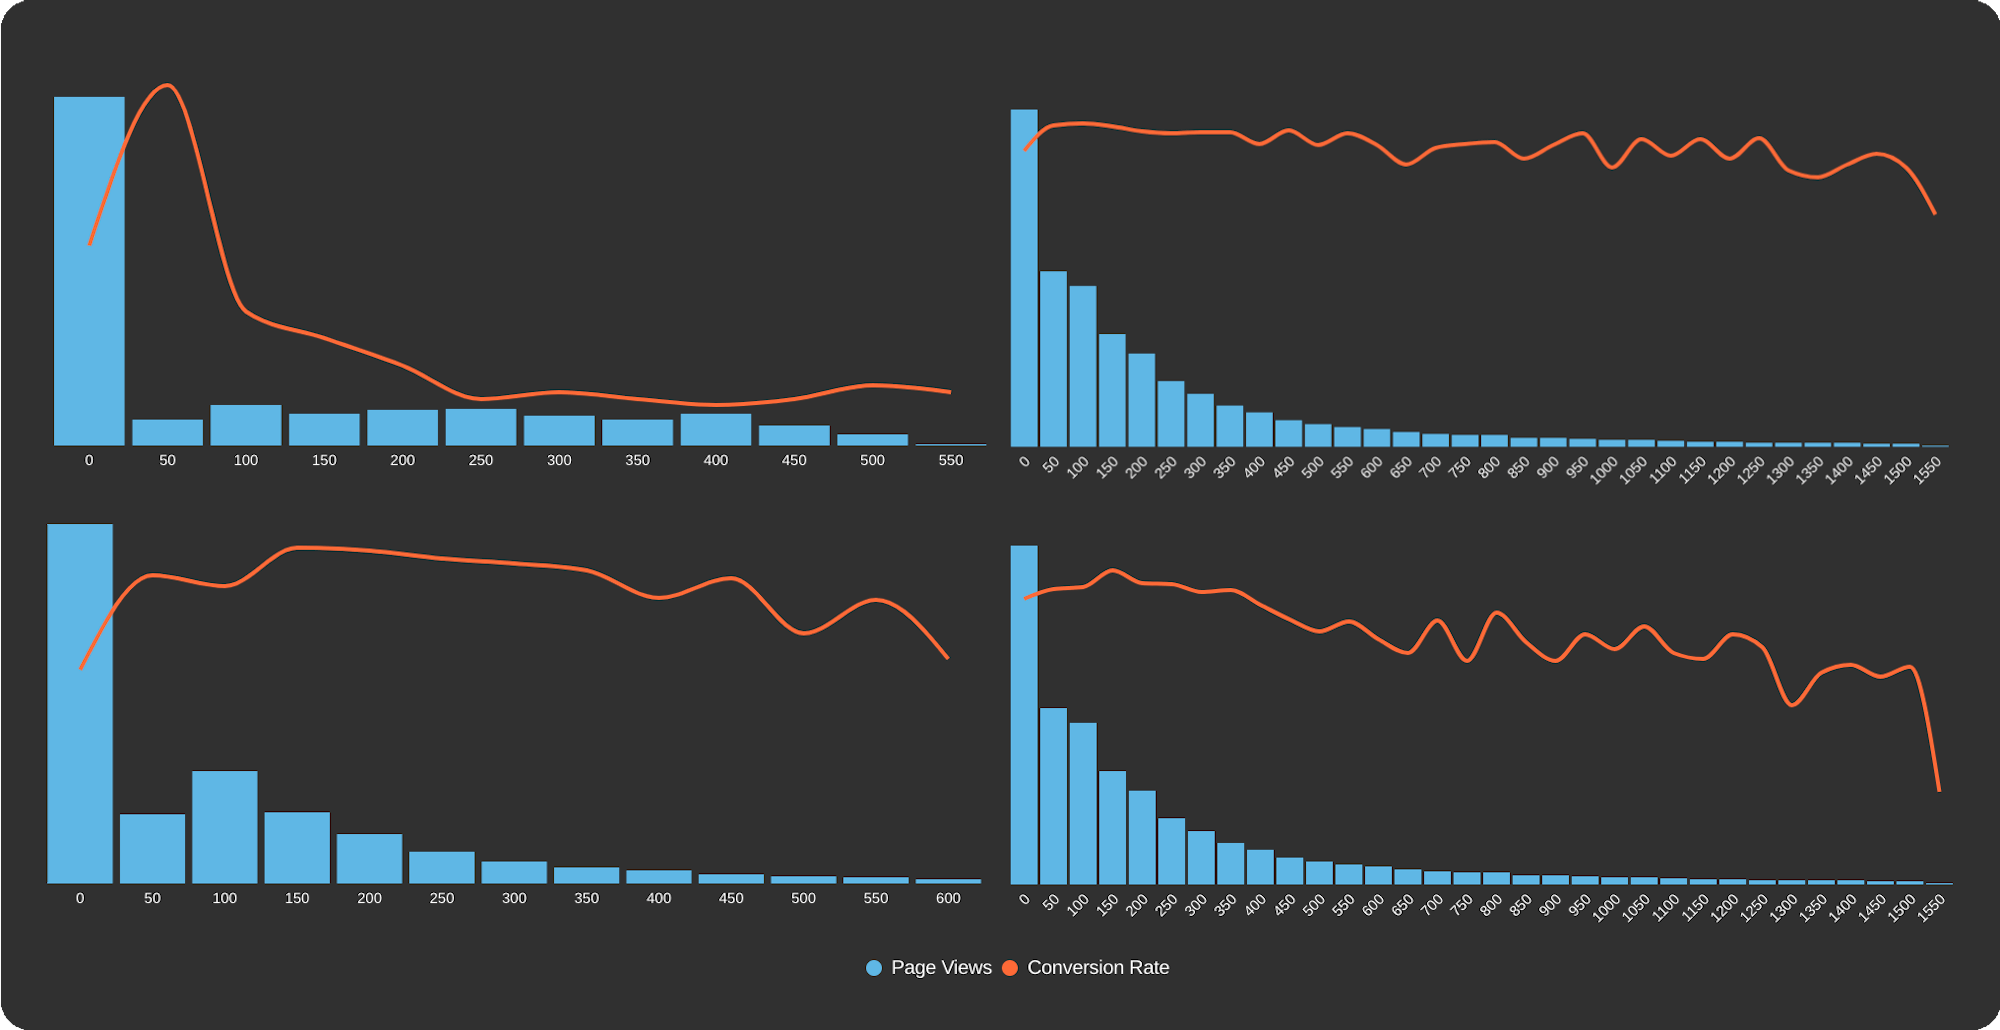
Correlation charts showing how INP affects user engagement
Element attribution
We've been collecting Interaction to Next Paint data for a while. Early on, we found that poor INP was an issue for a lot of folks, especially when looking at mobile users.
However, as a general time-based metric, INP didn't leave a lot of hints as to the source of the problem. Our early solutions leveraged our IX elements as a proxy for element attribution for INP. This is still a viable option for all non-Chromium browsers – which, to be clear, is probably more than half of your traffic! However, with the element selector directly attributed to INP for Chromium browsers, you are provided a lot of missing context.
After a bit of research and plenty of consultation with our customers, we've decided to expose the INP element selector. In addition, we've improved our classification for IX elements, making it easier to cross reference attribution with non-Chromium browsers.
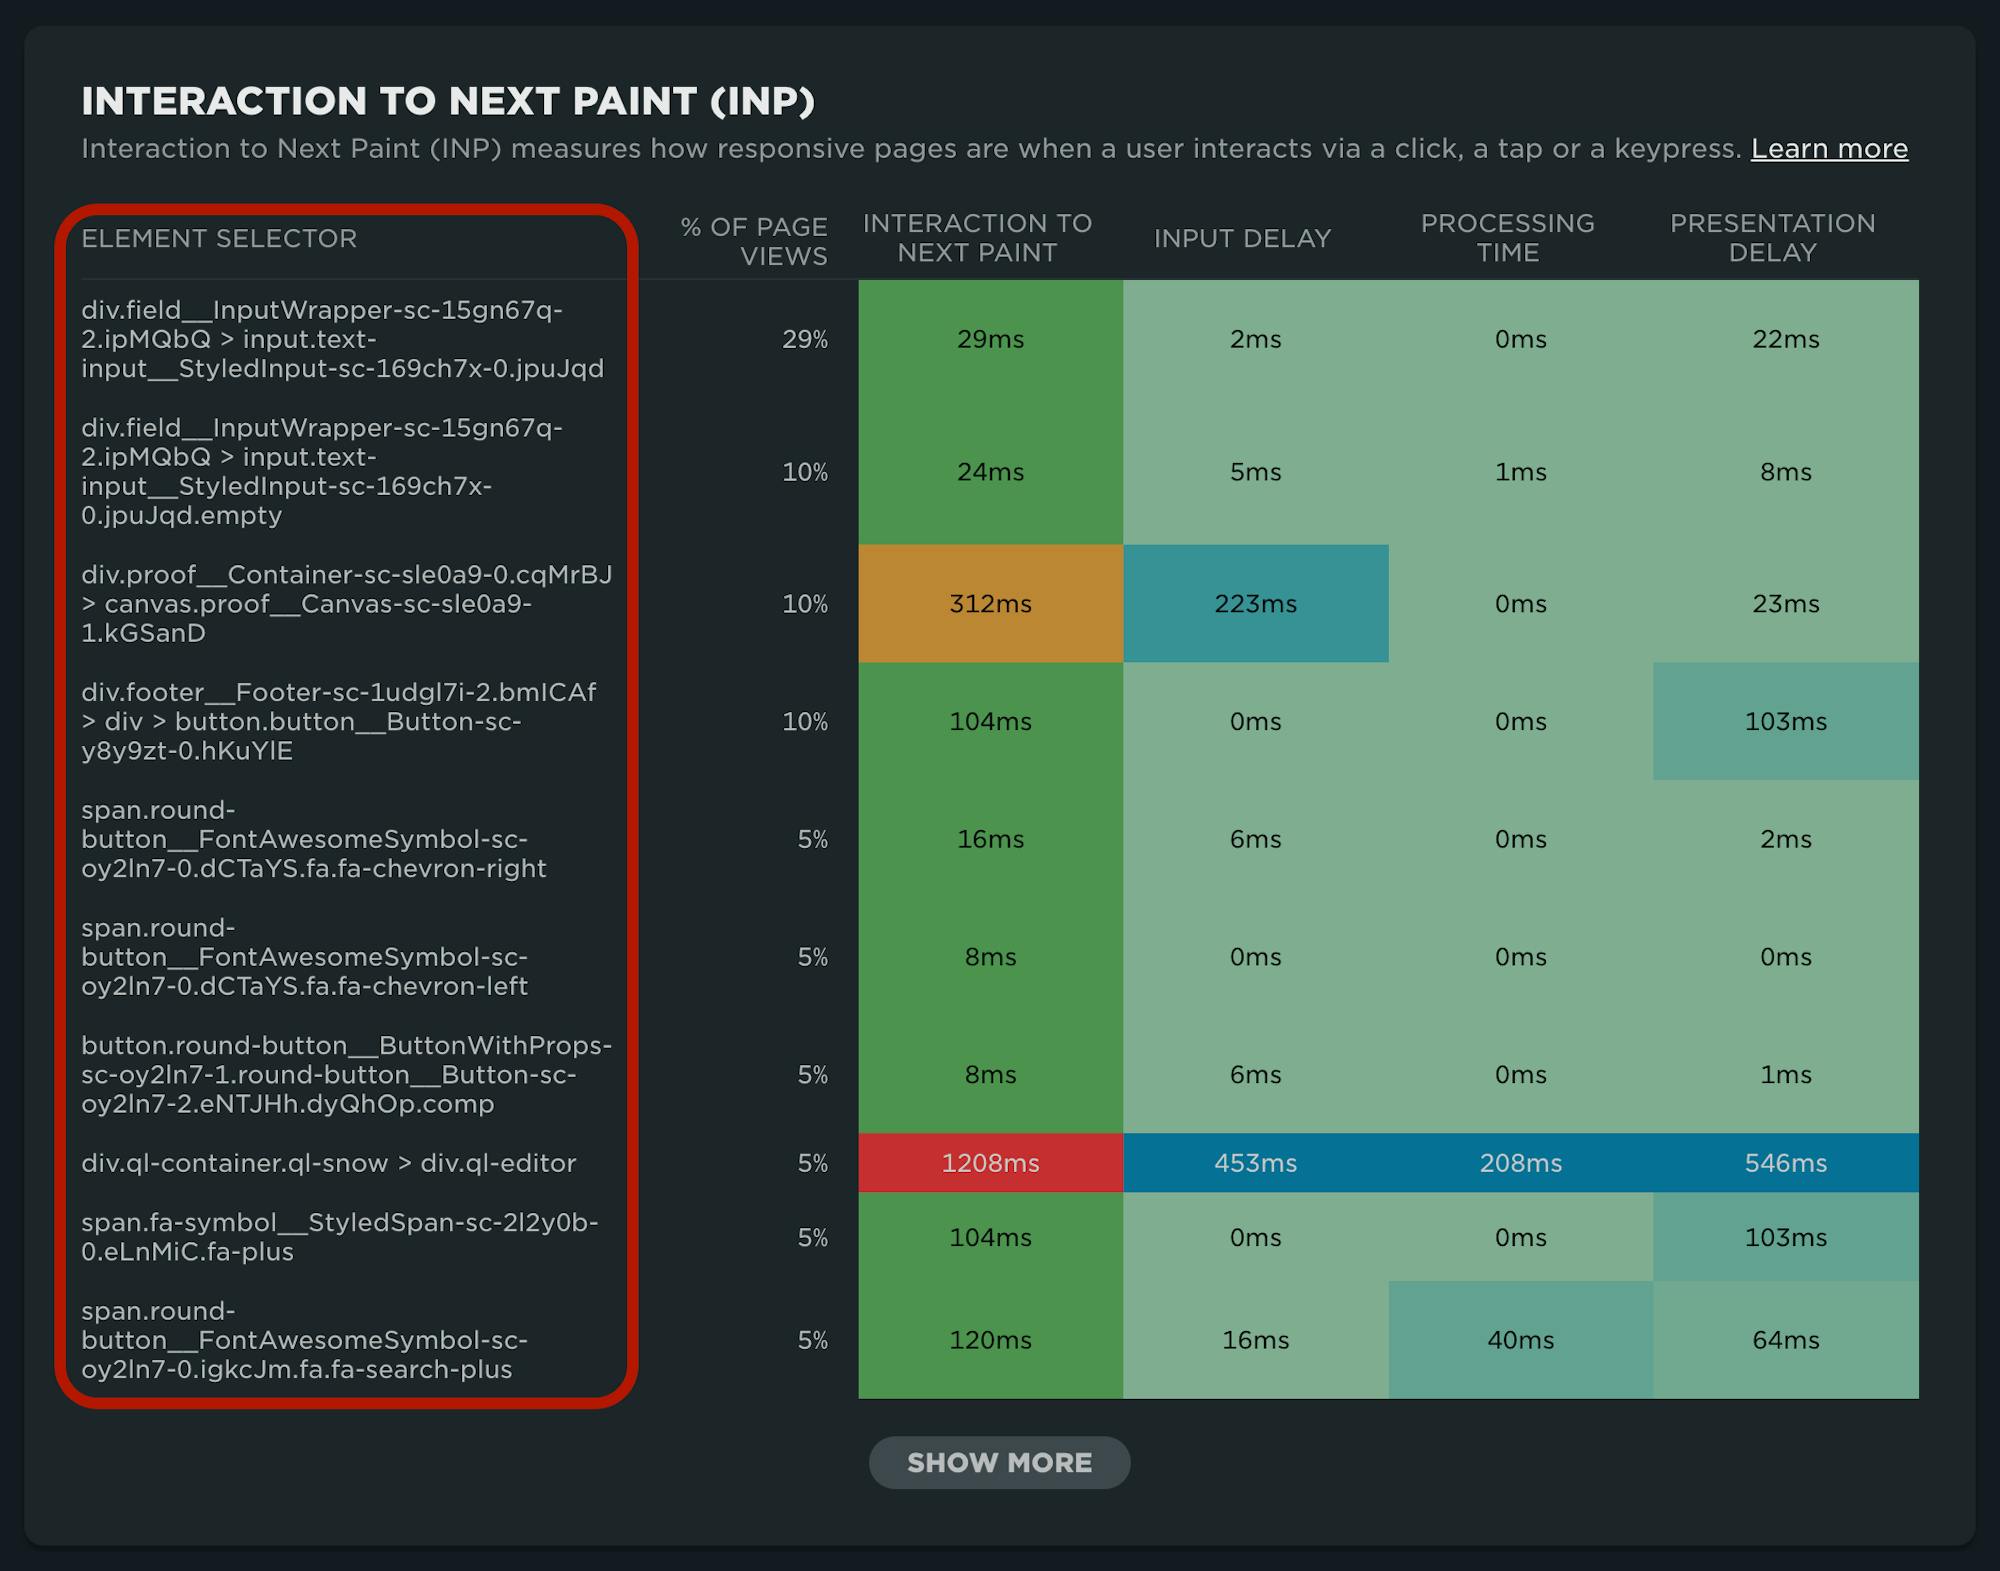
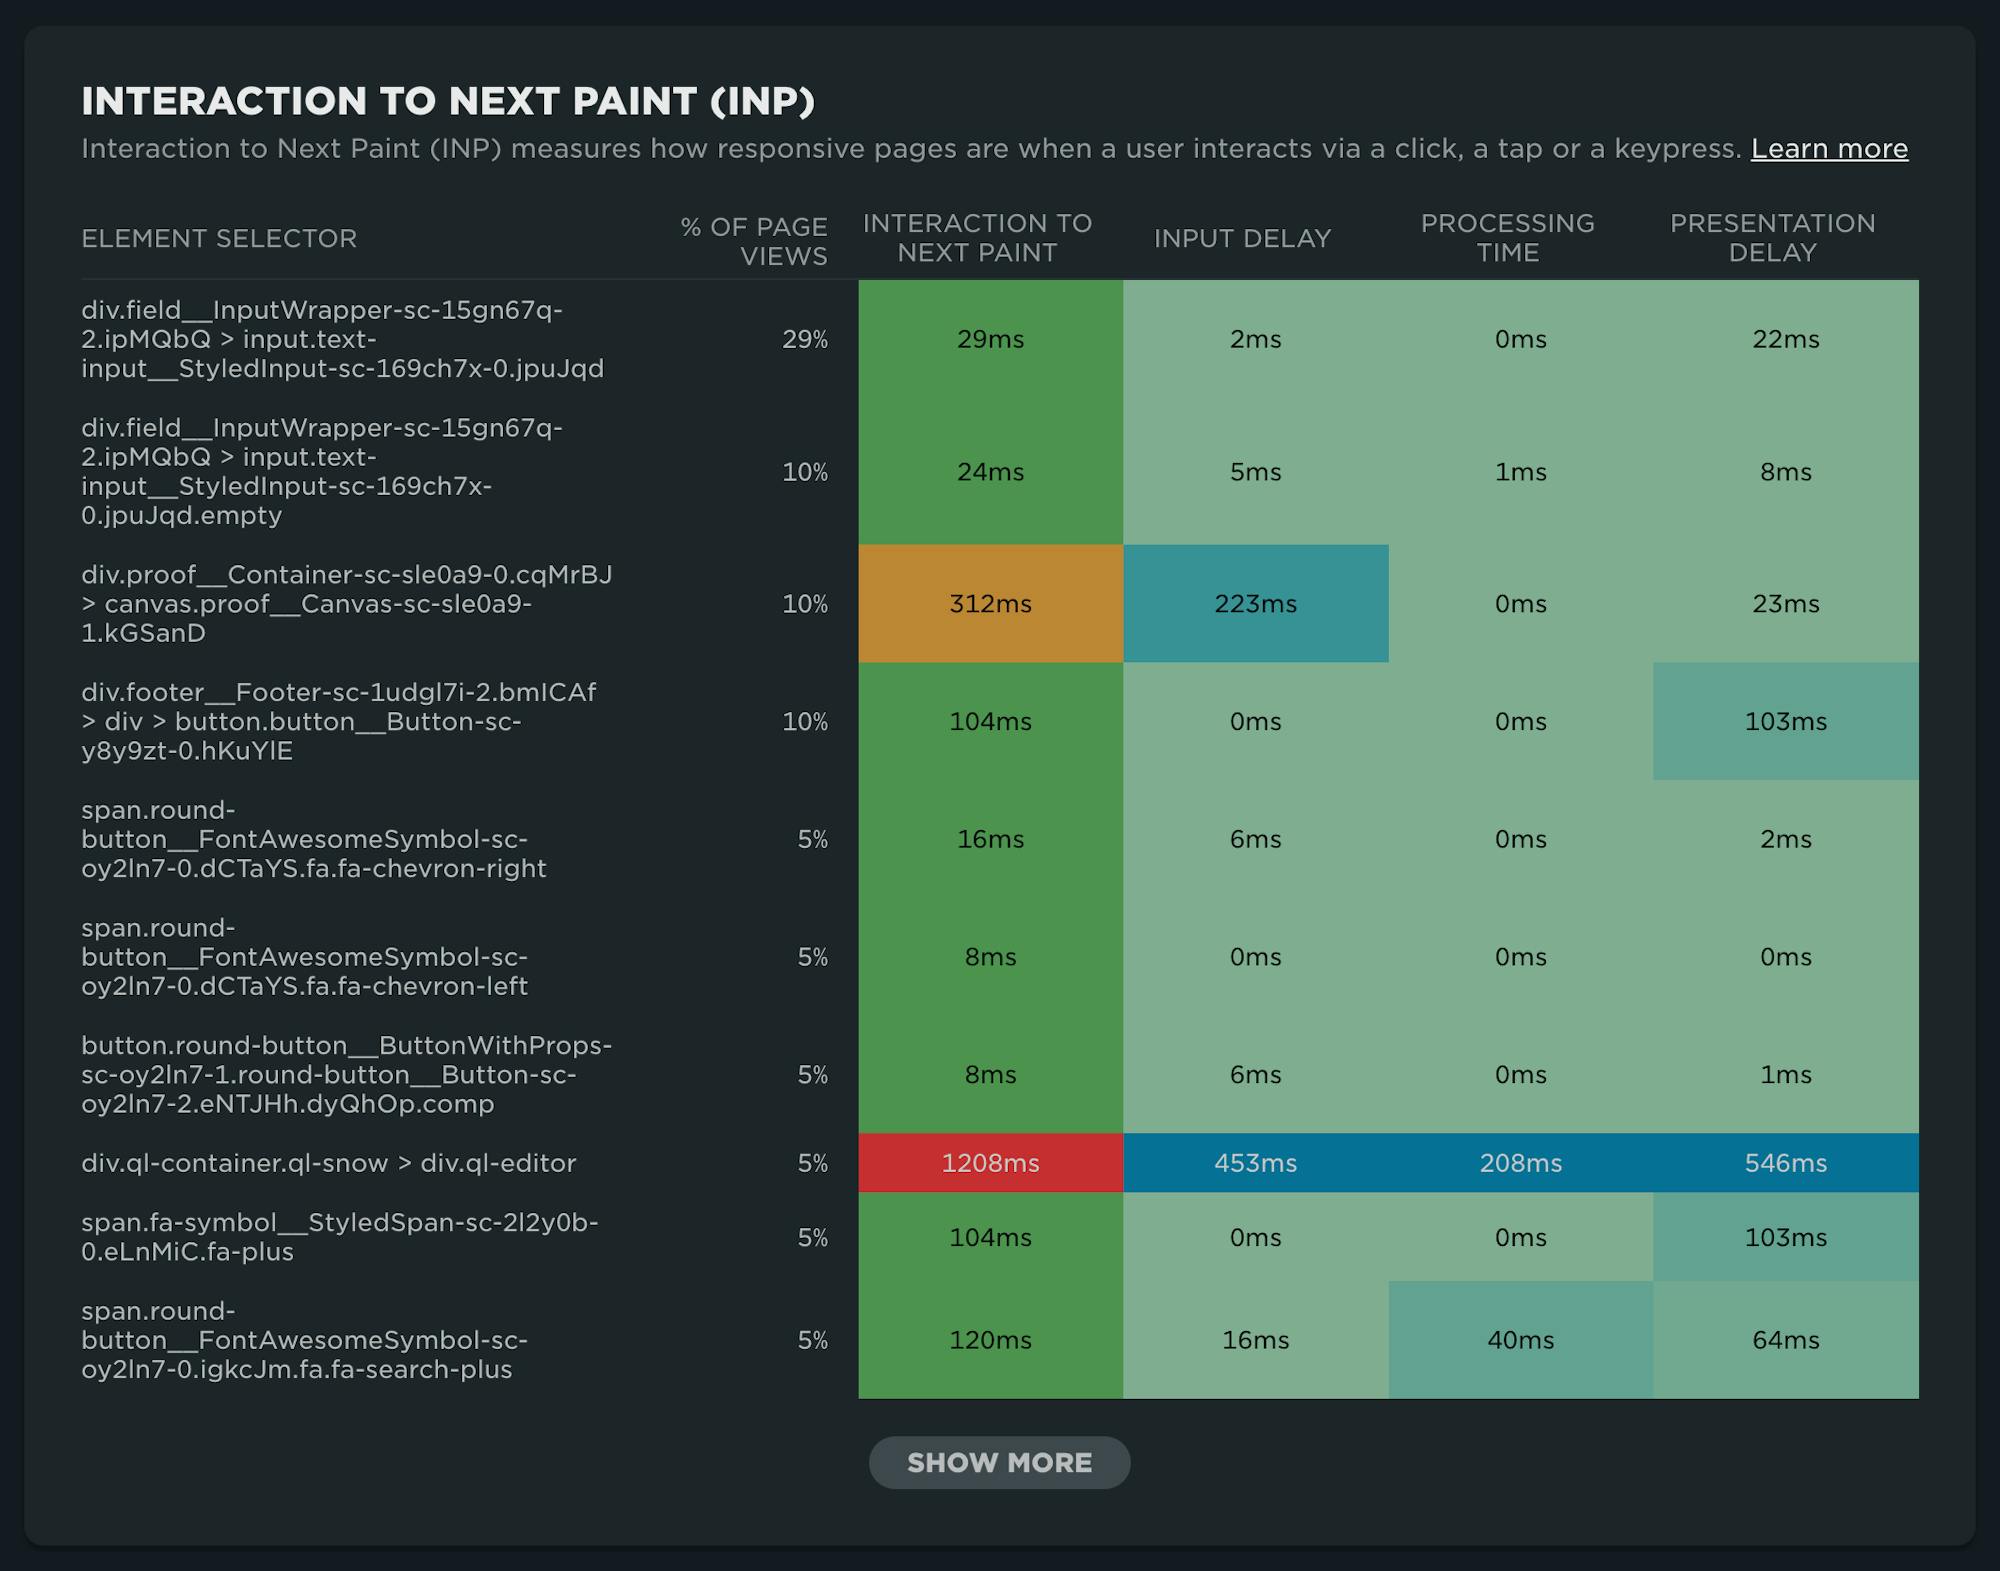
INP heatmap available in your RUM Performance dashboard
INP subparts
After identifying which interactions are responsible for Interaction to Next Paint issues, you'll want to understand where that time is being spent. This is provided with INP subparts, which are now collected for all SpeedCurve RUM users.
There are three main areas to look at when diagnosing INP times:
- Input delay
- Processing time
- Presentation delay
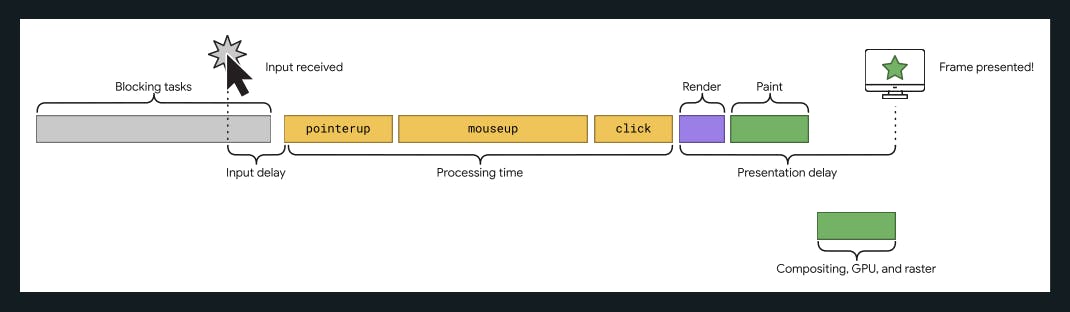
Source: INP: What's in an interaction?
Input delay
As you can see in the illustration above, input delay measures from the time that the user interaction started (when the input was received) until the event handler is able to run.
Processing time
Processing time includes the time it takes event callbacks, initiated by the interaction, to complete.
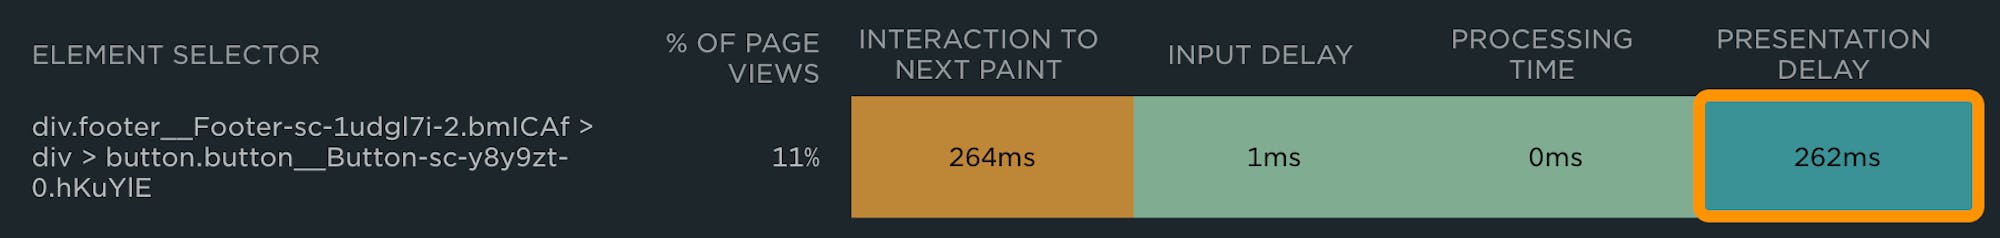
Presentation Delay
Simply put, presentation delay is the time it takes the frame to be presented after the event callbacks are completed.
Using SpeedCurve RUM to find and fix INP issues
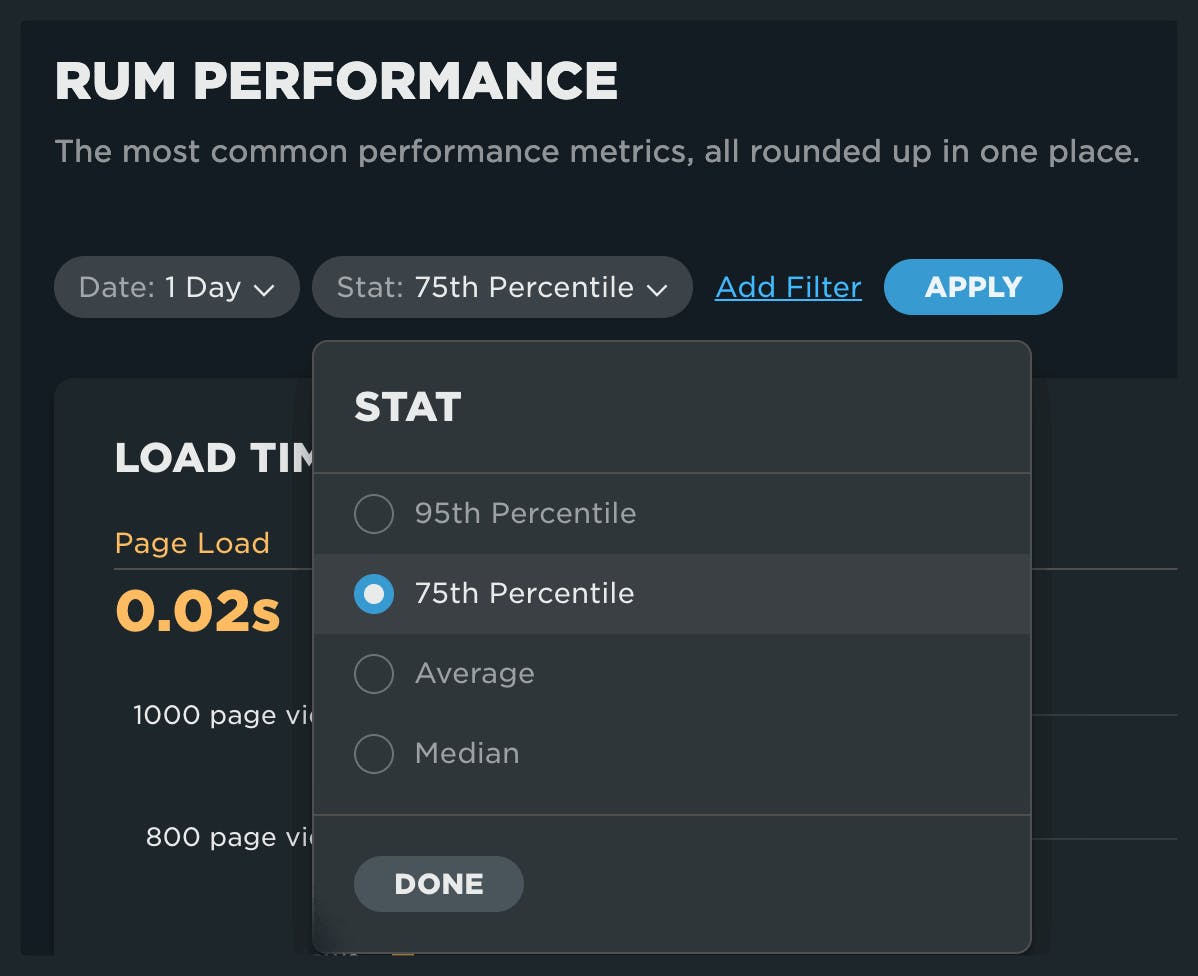
Once you've identified that Interaction to Next Paint is an issue for your page (or pages), you can use the heatmap shown above in your RUM Performance dashboard to identify problematic elements on your page.
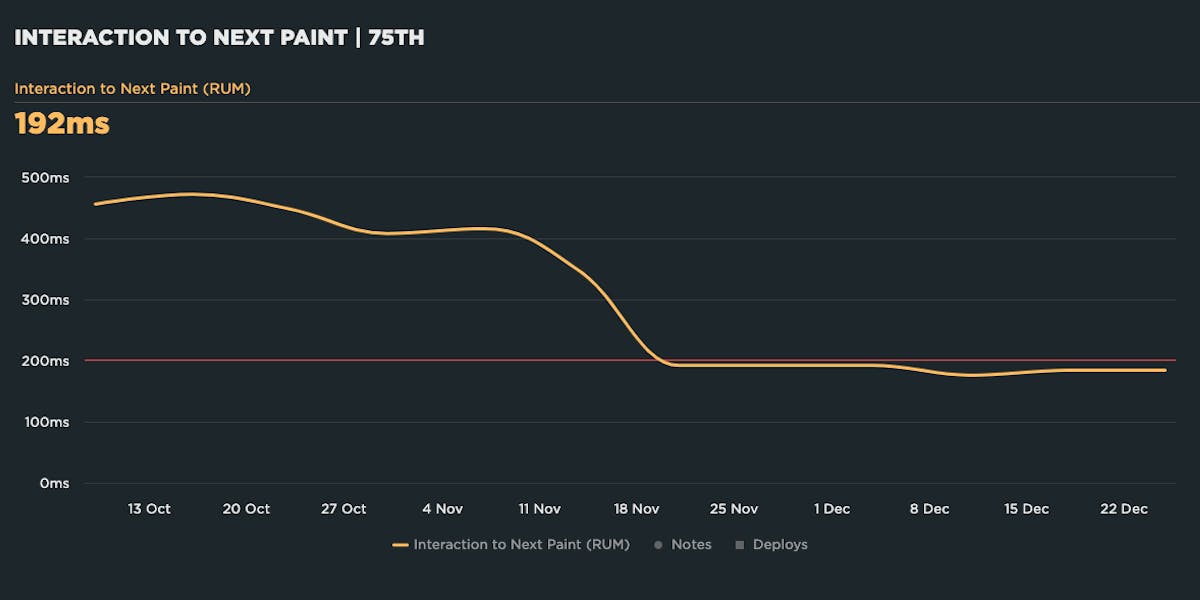
Step 1: Make sure you've set the RUM Performance dashboard filter to the 75th percentile
This is especially important if you are chasing INP issues you've identified via CrUX or Google Search Console.
Step 2: Navigate to the INP heatmap
Look for thresholds that have been exceeded, using the color-based Google-defined thresholds for INP:
- Green = <200ms
- Yellow = 200-500ms
- Red = >500ms
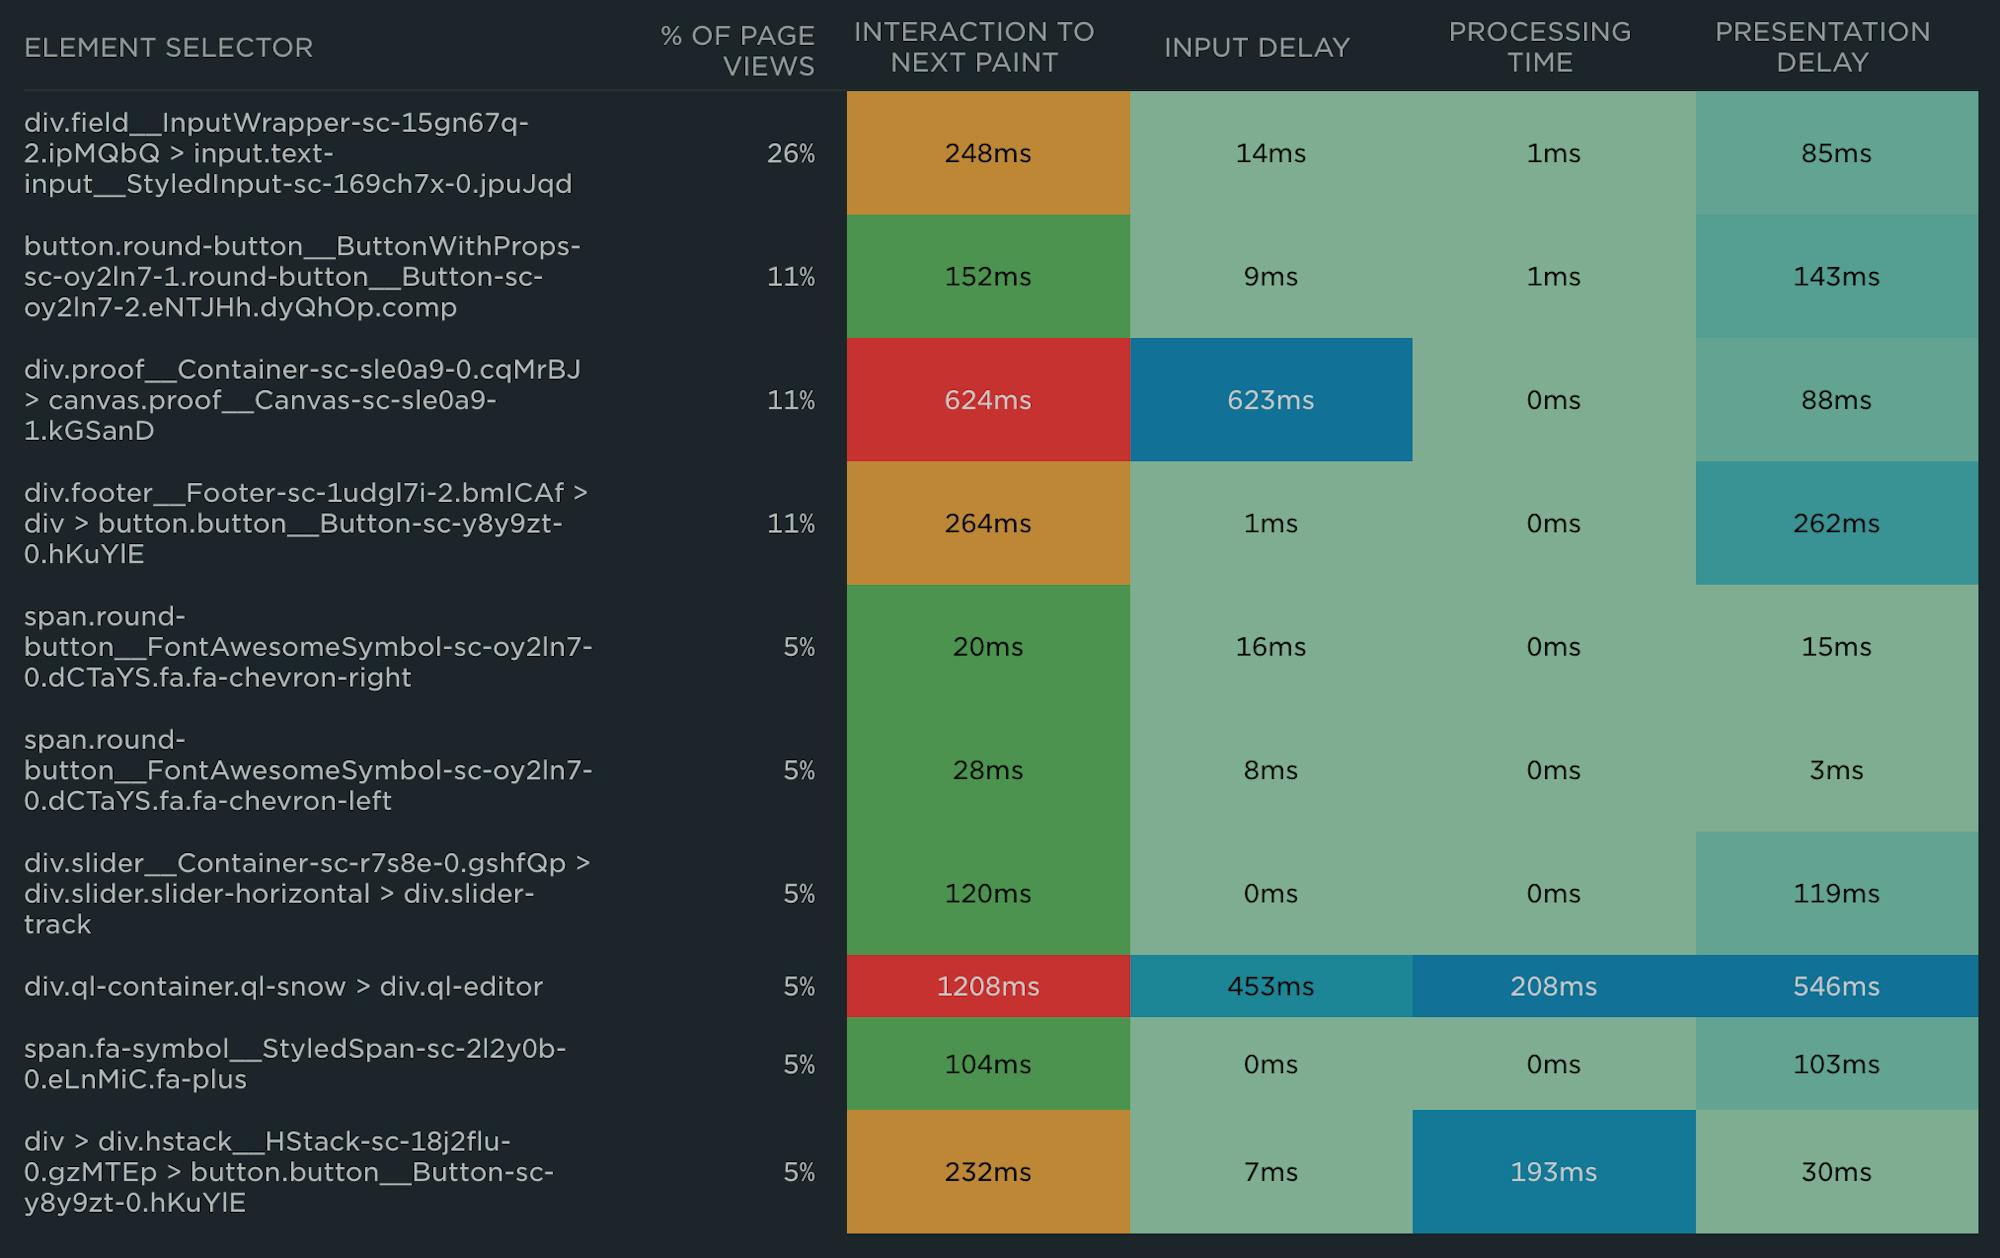
Step 3: Determine where the most time is spent
Below are a few examples to go along with this Web.dev post on Optimizing INP by Jeremy Wagner and Philip Walton.
Input delay
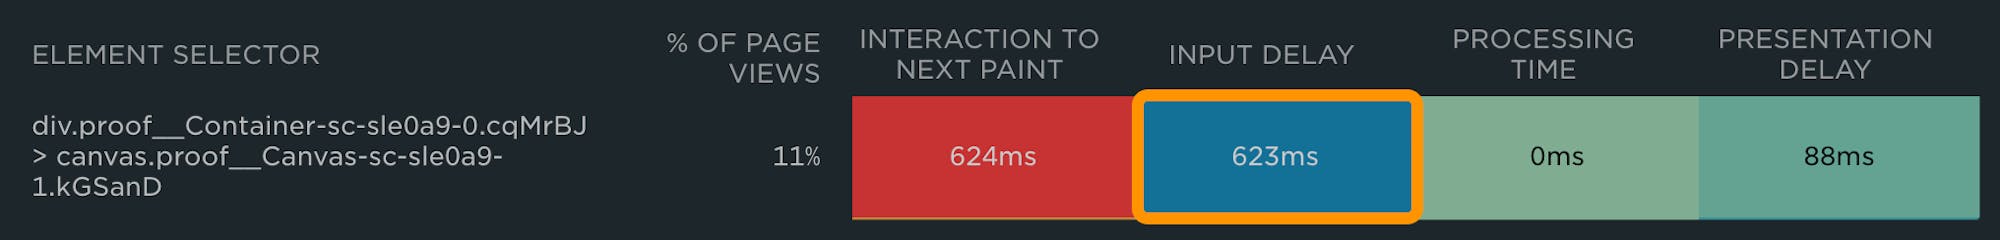
Factors that affect input delay generally include contending main thread work. Look for Long Tasks that appear to be in conflict with the interaction, fetch handlers, timer functions, or other competing interactions.
Processing delay
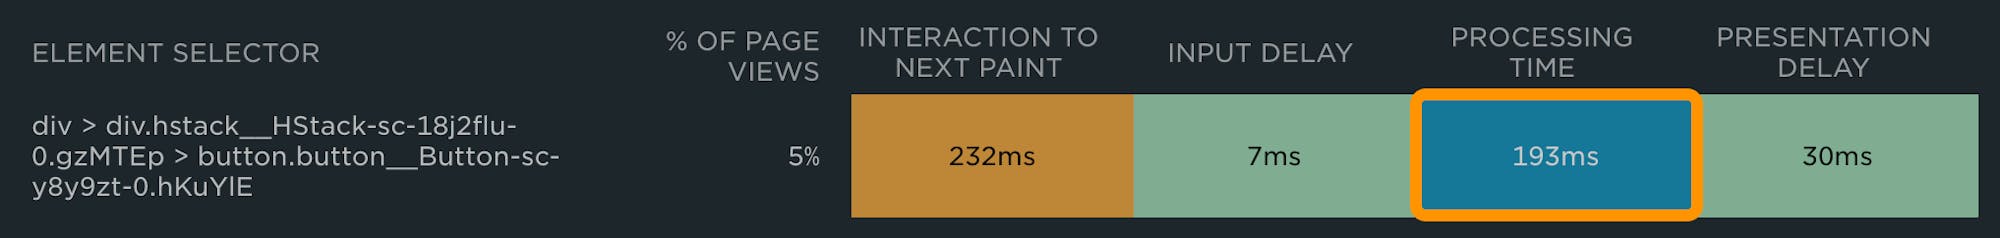
If time is spent here, look at optimizing event callbacks. As with Long Tasks, breaking things up into smaller chunks of work and deferring work not required for rendering is recommended.
Presentation delay
Issues with presentation delay are typically related to the complexity of the DOM. Other improvements to presentation delay may come by reducing the amount of client-side rendering required and deferring rendering of off-screen elements.
For a deeper dive into troubleshooting INP issues, see this post by Andy Davies which takes you through using Chrome DevTools to profile interactions.
What about iOS?
The lack of support for web performance metrics in Safari is not a new complaint, but it's a big one. Developers are left to their own devices to troubleshoot performance on iOS devices. While Apple hasn't announced any plans to support any of the Core Web Vitals soon, there is some ability to triangulate on potential issues that might affect the user experience.
As an example, the Interaction Metrics (IX) captured by SpeedCurve are available for Safari. With the latest upgrades to RUM, we've made it easier to identify those IX elements, which tend to align very closely with the INP element selectors we see for Chromium. This guide to finding and fixing INP issues using IX elements as a proxy still applies!
Looking ahead at RUM diagnostics
Team SpeedCurve is very excited! Here's what we'll be up to over the coming months:
- We'll be making a lot of updates and improvements to our data pipeline, which will allow us to continue our mission of making RUM even more actionable.
- We'll be focused on improving the diagnostic capabilities for the remaining Core Web Vitals, Largest Contentful Paint (LCP) and Cumulative Layout Shift (CLS).
- We'll also be focused on enhanced support for the increasing complexity of measuring the entire lifecycle of the page.
We're excited to roll out this update for Interaction to Next Paint and hope you get a lot of use from it. As always, we value your feedback, so shoot us a note and let us know what you think!

Read Next

What is INP? How does it correlate with user behaviour, such as bounce and conversion rates? And how can you improve it?
Learn what INP is, how to identify and debug slow interactions... and most important, how to make them faster!