article thumbnail

Timestone: Netflix’s High-Throughput, Low-Latency Priority Queueing System with Built-in Support…

The Netflix TechBlog

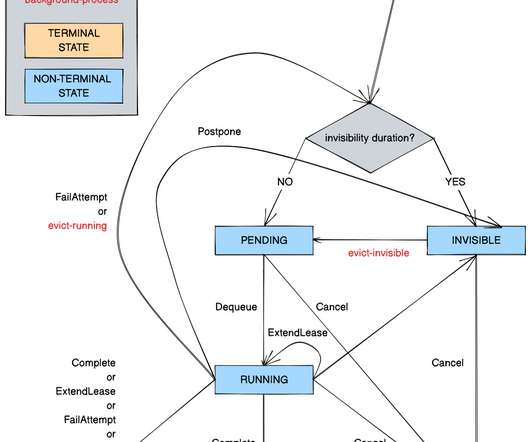
Timestone: Netflix’s High-Throughput, Low-Latency Priority Queueing System with Built-in Support for Non-Parallelizable Workloads by Kostas Christidis Introduction Timestone is a high-throughput, low-latency priority queueing system we built in-house to support the needs of Cosmos , our media encoding platform. Over the past 2.5

Latency 212
article thumbnail

Presentation: Azure Cosmos DB: Low Latency and High Availability at Planet Scale

InfoQ

Mei-Chin Tsai, Vinod discuss the internal architecture of Azure Cosmos DB and how it achieves high availability, low latency, and scalability. By Mei-Chin Tsai, Vinod Sridharan

Latency 52
Insiders

Sign Up for our Newsletter

This site is protected by reCAPTCHA and the Google Privacy Policy and Terms of Service apply.

Trending Sources

article thumbnail

Presentation: The Journey to a Million Ops / Sec / Node in Venice

InfoQ

Alex Dubrouski, Gaojie Liu discuss some of the tricks used in their pursuit to lower read latency and to reach 1M operations per second per node. By Alex Dubrouski, Gaojie Liu

Latency 84
article thumbnail

Bandwidth or Latency: When to Optimise for Which

CSS Wizardry

When it comes to network performance, there are two main limiting factors that will slow you down: bandwidth and latency. Latency is defined as…. Where bandwidth deals with capacity, latency is more about speed of transfer 2. and reduction in latency. and reduction in latency. Bandwidth is defined as….

Latency 133
article thumbnail

Scalable Annotation Service?—?Marken

The Netflix TechBlog

The service should be able to serve real-time, aka UI, applications so CRUD and search operations should be achieved with low latency. Our service will be used by a lot of internal UI applications hence the latency for CRUD and search operations must be low. Search latency for the generic text queries are in milliseconds.

article thumbnail

Crucial Redis Monitoring Metrics You Must Watch

Scalegrid

Key Takeaways Critical performance indicators such as latency, CPU usage, memory utilization, hit rate, and number of connected clients/slaves/evictions must be monitored to maintain Redis’s high throughput and low latency capabilities. Similarly, an increased throughput signifies an intensive workload on a server and a larger latency.

Metrics 130
article thumbnail

Optimize your environment: Unveiling Dynatrace Hyper-V extension for enhanced performance and efficient troubleshooting

Dynatrace

This presents a challenge for IT operations teams, specifically in identifying and addressing performance issues or planning how to prevent future issues. Therefore, they experience how the application code functions and how the application operations depend on the underlying hardware resources and the operating system managed by Hyper-V.