article thumbnail

Why applying chaos engineering to data-intensive applications matters

Dynatrace

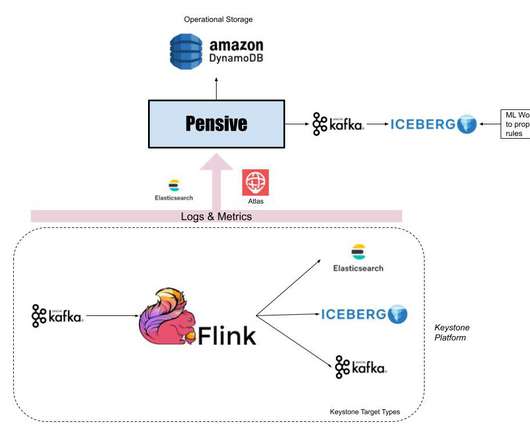
Optimized fault recovery We’re also interested in exploring the potential of tuning configurations to improve recovery speed and performance after failures and avoid the demand for additional computing resources. From the Kafka Streams community, one of the configurations mostly tuned in production is adding standby replicas.

article thumbnail

Dynatrace simplifies StatsD, Telegraf, and Prometheus observability with Davis AI

Dynatrace

Open-source metric sources automatically map to our Smartscape model for AI analytics. We’ve just enhanced Dynatrace OneAgent with an open metric API. Here’s a quick overview of what you can achieve now that the Dynatrace Software Intelligence Platform has been extended to ingest third-party metrics. Dynatrace news.

Insiders

Sign Up for our Newsletter

This site is protected by reCAPTCHA and the Google Privacy Policy and Terms of Service apply.

Trending Sources

article thumbnail

New Prometheus-based extensions enable intelligent observability for more than 200 additional technologies

Dynatrace

Building on its advanced analytics capabilities for Prometheus data , Dynatrace now enables you to create extensions based on Prometheus metrics. Many technologies expose their metrics in the Prometheus data format. Easily gain actionable insights with the Dynatrace Extension for Prometheus metrics. Dynatrace news.

article thumbnail

Dynatrace extends automatic and intelligent observability to cloud and Kubernetes logs for smarter automation at scale

Dynatrace

Every service and component exposes observability data (metrics, logs, and traces) that contains crucial information to drive digital businesses. To connect these siloes, and to make sense out of it requires massive manual efforts including code changes and maintenance, heavy integrations, or working with multiple analytics tools.

Cloud 263
article thumbnail

How Netflix uses eBPF flow logs at scale for network insight

The Netflix TechBlog

Cloud Network Insight is a suite of solutions that provides both operational and analytical insight into the cloud network infrastructure to address the identified problems. The Flow Exporter also publishes various operational metrics to Atlas. These metrics are visualized using Lumen , a self-service dashboarding infrastructure.

Network 325
article thumbnail

Dynatrace Named a Leader and Positioned Furthest for Vision and Highest in Execution in the 2023 Gartner® Magic Quadrant™ for Application Performance Monitoring and Observability

Dynatrace

Here is what a few of these customers say about Dynatrace: “ Dynatrace has been a game changer in our ability to respond to incidents, identify areas for performance tuning, and gain meaningful data from user behavior analysis.” In these two reports, Dynatrace is the only provider to be recognized as a Leader and as a Customers’ Choice.

article thumbnail

How digital experience monitoring helps deliver business observability

Dynatrace

Fast, consistent application delivery creates a positive user experience that can ultimately drive customer loyalty and improve business metrics like conversion rate and user retention. Expanding on the traditional observability pillars of metrics, logs, and traces, DEM collects user experience data to complete the end-to-end picture.