Remove Analytics Remove Cloud Remove Metrics Remove Tuning
article thumbnail

Unlock log analytics: Seamless insights without writing queries

Dynatrace

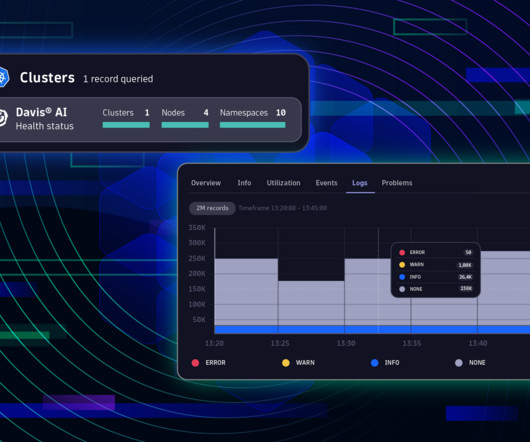
What about correlated trace data, host metrics, real-time vulnerability scanning results, or log messages captured just before an incident occurs? Dynatrace automatically puts logs into context Dynatrace Log Management and Analytics directly addresses these challenges. This context is vital to understanding issues.

Analytics 176
article thumbnail

Data lakehouse innovations advance the three pillars of observability for more collaborative analytics

Dynatrace

The short answer: The three pillars of observability—logs, metrics, and traces—converging on a data lakehouse. Grail data lakehouse delivers massively parallel processing for answers at scale Modern cloud-native computing is constantly upping the ante on data volume, variety, and velocity.

Analytics 191
Insiders

Sign Up for our Newsletter

This site is protected by reCAPTCHA and the Google Privacy Policy and Terms of Service apply.

Trending Sources

article thumbnail

Accelerate your cloud journey with Dynatrace observability for AWS S3 logs

Dynatrace

Logs complement metrics and enable automation Cloud practitioners agree that observability, security, and automation go hand in hand. The increasing complexity of cloud service architectures requires a rock-solid understanding of the activity, health status, and security of cloud services.

AWS 204
article thumbnail

Why log monitoring and log analytics matter in a hyperscale world

Dynatrace

Log monitoring, log analysis, and log analytics are more important than ever as organizations adopt more cloud-native technologies, containers, and microservices-based architectures. Driving this growth is the increasing adoption of hyperscale cloud providers (AWS, Azure, and GCP) and containerized microservices running on Kubernetes.

Analytics 214
article thumbnail

Automate complex metric-related use cases with the Metrics API version 2

Dynatrace

Dynatrace collects a huge number of metrics for each OneAgent-monitored host in your environment. Depending on the types of technologies you’re running on individual hosts, the average number of metrics is about 500 per computational node. Running metric queries on a subset of entities for live monitoring and system overviews.

Metrics 231
article thumbnail

Dynatrace extends automatic and intelligent observability to cloud and Kubernetes logs for smarter automation at scale

Dynatrace

Leveraging cloud-native technologies like Kubernetes or Red Hat OpenShift in multicloud ecosystems across Amazon Web Services (AWS) , Microsoft Azure, and Google Cloud Platform (GCP) for faster digital transformation introduces a whole host of challenges. Dynatrace news. Connecting data siloes requires daunting integration endeavors.

Cloud 261
article thumbnail

Dynatrace PurePath 4 integrates OpenTelemetry and the latest cloud-native technologies and provides analytics and AI at scale

Dynatrace

New cloud-native technologies make observability more important than ever…. Dynatrace PurePath 4 extends automatic distributed tracing to OpenTelemetry and the latest cloud-native technologies. In this example you can see on the left side that the Envoy payment service is running on a Linux host, deployed in the Google cloud.

Analytics 159