Remove tags devtools
article thumbnail

In Defence of DOM­Content­Loaded

CSS Wizardry

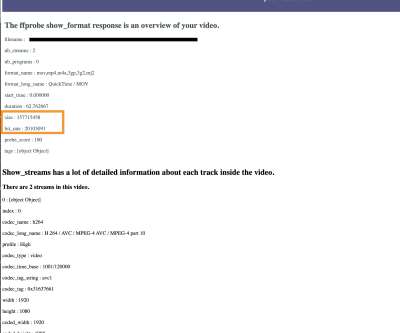
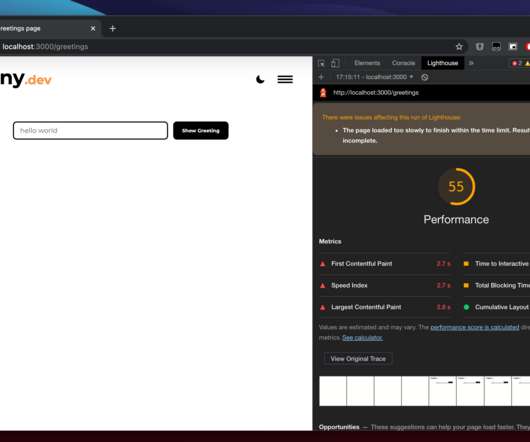
domContentLoadedEventStart And of course, we should be very used to seeing DOMContentLoaded at the bottom of DevTools’ Network panel: They’re some satisfying numbers. Basically, the browser is now at the tag. log ( window. performance. domContentLoadedEventStart - window. performance. performance. domContentLoadedEventEnd - window.

Metrics 326
article thumbnail

Debugging Interaction to Next Paint (INP)

Speed Curve

Profiling Interactions Once we know which pages have high INP times, and what are the popular interactions on those pages, I switch to Chrome DevTools, profile the interactions, and identify ways to improve them. Switching to the DevTools Performance panel 3. Opening a guest profile in Chrome 2.

Insiders

Sign Up for our Newsletter

This site is protected by reCAPTCHA and the Google Privacy Policy and Terms of Service apply.

Trending Sources

article thumbnail

The Fight For The Main Thread

Smashing Magazine

All of that is dumped on any given page in one fell swoop courtesy of Google Tag Manager (GTM), which allows us to deploy and run scripts without having to go through the pain of re-deploying the entire site. Adding the async attribute to a <script> tag will load the script asynchronously, executing it as soon as it’s downloaded.

Google 90
article thumbnail

Chrome DevTools - 20+ Tips and Tricks

KeyCDN

The Chrome DevTools can greatly improve your workflow by helping you develop, test, and debug your websites right within your browser. Many of you probably use Chrome DevTools on a regular basis, but check out these additional tips and tricks to enhance your productivity. What Are the Google Chrome DevTools?

Google 85
article thumbnail

Google Lighthouse Audits – How to use Chrome’s built-in speed testing tool

MachMetrics

If you’re not a developer/designer, you may not be familiar with the Chrome DevTools and the extremely powerful Google Lighthouse Audits that can be found inside. To use Lighthouse through the Chome Dev tools, simply open the DevTools and navigate to the Audits tab. Intimidated by the DevTools area? Accessibility.

Google 82
article thumbnail

Fixing a slow site iteratively

CSS - Tricks

The Lighthouse reports can be accessed directly in Chrome’s DevTools. Using a network request inspector, I’m going to see if there’s anything we can remove via the Network panel in DevTools. We could also use a tool, like Postman if we need to, but we’ll limit our work to DevTools as much as possible for the sake of simplicity.

Cache 92
article thumbnail

The Humble ` ` Element And Core Web Vitals

Smashing Magazine

You can find it in the Chrome DevTools suite of debugging tools and run it against any web page, public or requiring authentication. This is an empty element — it has no closing tag — requiring a minimum of one attribute to be helpful: src , the source. It also shows up on hover in the DevTools Performance panel.

Media 145