article thumbnail

Support of OpenTelemetry metrics with enhanced AI capabilities

Dynatrace

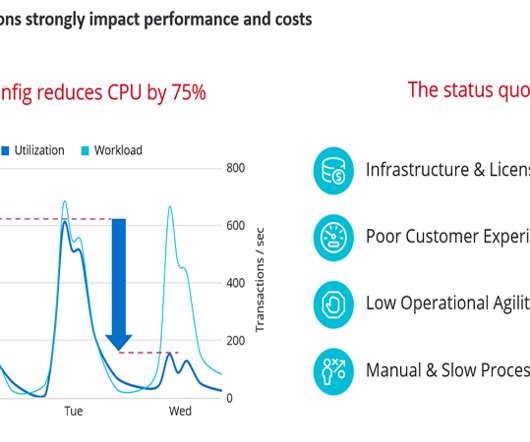
With the most important components becoming release candidates , Dynatrace now supports the full OpenTelemetry specification on all runtimes and automatically adds intelligence to metrics at enterprise scale. So these metrics are immensely valuable to SRE and DevOps teams. Automation and intelligence for metrics at enterprise scale.

Metrics 228
article thumbnail

Google Cloud Next 2024: AI innovation for Google Cloud

Dynatrace

Check out the following related resources to learn more: Dynatrace announces support of Google Cloud’s AlloyDB for PostgreSQL metrics ingest – Blog Dynatrace has achieved Google Cloud Ready – AlloyDB designation in support of an extended integration to Google Cloud’s AlloyDB for PostgreSQL. Learn more.

Google 261
Insiders

Sign Up for our Newsletter

This site is protected by reCAPTCHA and the Google Privacy Policy and Terms of Service apply.

Trending Sources

article thumbnail

9 key DevOps metrics for success

Dynatrace

The emerging concepts of working with DevOps metrics and DevOps KPIs have really come a long way. DevOps metrics to help you meet your DevOps goals. Like any IT or business project, you’ll need to track critical key metrics. Here are nine key DevOps metrics and DevOps KPIs that will help you be successful.

DevOps 200
article thumbnail

What is? OpenTelemetry??An open-source standard for logs, metrics, and traces

Dynatrace

Loosely defined, observability is the ability to understand what’s happening inside a system from the knowledge of the external data it produces, which are usually logs, metrics, and traces. Logs, metrics, and traces make up the bulk of all telemetry data. Watch webinar now! How does OpenTelemetry work?

article thumbnail

Application observability meets developer observability: Unlock a 360º view of your environment

Dynatrace

In a recent webinar , Dynatrace DevOps activist Andi Grabner and senior software engineer Yarden Laifenfeld explored developer observability. When an incident occurs, developers need to know what data to look at, where the incident occurred, and other relevant metrics. To watch the full webinar, check out the on-demand recording here.

article thumbnail

Dynatrace SaaS on Azure now Generally Available

Dynatrace

Dynatrace captures all your data, including host and application metrics, basic-network metrics, real-user metrics, mobile metrics, cloud-infrastructure metrics, log metrics, and much more. Security: Data is stored securely in the Dynatrace cloud (powered by Azure).

Azure 320
article thumbnail

Reignite Your SAFe® Journey with Flow Metrics

Tasktop

That’s why I’m so excited to see Flow Metrics added to the latest SAFe iteration. outlines three core metrics : Outcomes : Are your solutions meeting the needs of customers and business? To support this goal, we have refactored, refined and extended our approach to metrics into three measurement domains, Outcomes , Flow and Competency.

Metrics 98