article thumbnail

Trace, diagnose, resolve: Introducing the Infrastructure & Operations app for streamlined troubleshooting

Dynatrace

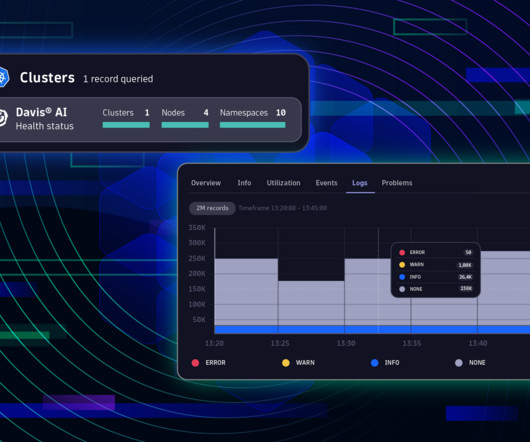
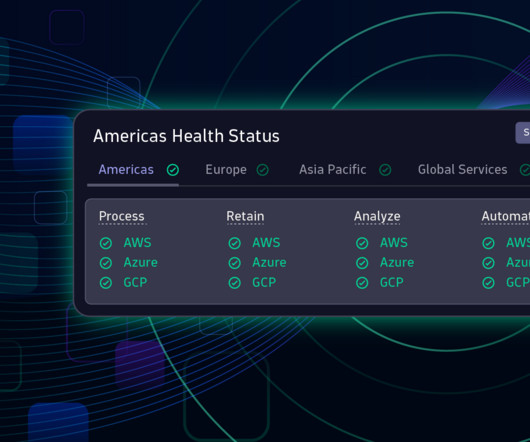
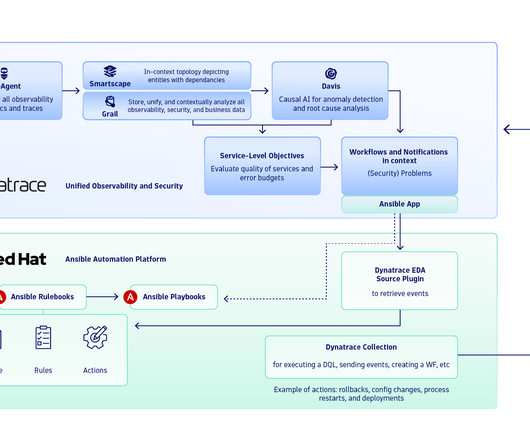
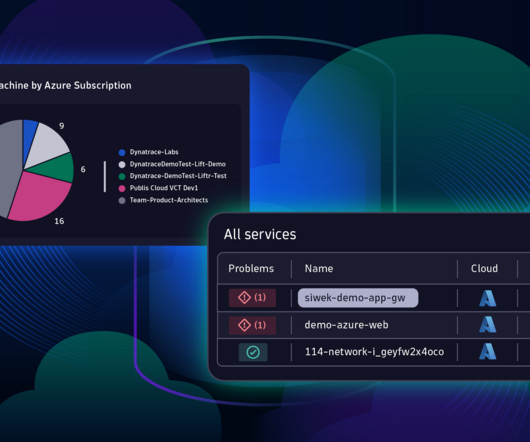
Infrastructure and operations teams must maintain infrastructure health for IT environments. To overcome these complex issues, teams must quickly find root causes among numerous alerts and metrics. Traditional tools struggle with the intricacy of modern cloud services and containerized applications.

article thumbnail

Business Flow: Why IT operations teams should monitor business processes

Dynatrace

The business process observability challenge Increasingly dynamic business conditions demand business agility; reacting to a supply chain disruption and optimizing order fulfillment are simple but illustrative examples. Most business processes are not monitored. First and foremost, it’s a data problem.

Insiders

Sign Up for our Newsletter

This site is protected by reCAPTCHA and the Google Privacy Policy and Terms of Service apply.

Trending Sources

article thumbnail

Protecting critical infrastructure and services: Ensure efficient, accurate information delivery this election year

Dynatrace

The importance of critical infrastructure and services While digital government is necessary, protecting critical infrastructure and services is equally important. Critical infrastructure and services refer to the systems, facilities, and assets vital for the functioning of society and the economy.

article thumbnail

Extend infrastructure observability with JMX Extensions and additional full-stack metrics

Dynatrace

Infrastructure exists to support the backing services that are collectively perceived by users to be your web application. Issues that manifest themselves as performance degradation on a user’s device can often be traced back to underlying infrastructure issues. Monitor additional metrics. Dynatrace news.

article thumbnail

What is observability? Not just logs, metrics and traces

Dynatrace

In IT and cloud computing, observability is the ability to measure a system’s current state based on the data it generates, such as logs, metrics, and traces. An advanced observability solution can also be used to automate more processes, increasing efficiency and innovation among Ops and Apps teams.

Metrics 363
article thumbnail

How to collect Prometheus metrics in Dynatrace

Dynatrace

Dynatrace has recently extended its Kubernetes operator by adding a new feature, the Prometheus OpenMetrics Ingest , which enables you to import Prometheus metrics in Dynatrace and build SLO and anomaly detection dashboards with Prometheus data. Here we’ll explore how to collect Prometheus metrics and what you can achieve with them.

Metrics 210
article thumbnail

Observability engineering: Getting Prometheus metrics right for Kubernetes with Dynatrace and Kepler

Dynatrace

To get a more granular look into telemetry data, many analysts rely on custom metrics using Prometheus. Named after the Greek god who brought fire down from Mount Olympus, Prometheus metrics have been transforming observability since the project’s inception in 2012.

Metrics 186