Remove hub detail dashboards
article thumbnail

Easily monitor IBM i with updated Dynatrace extension

Dynatrace

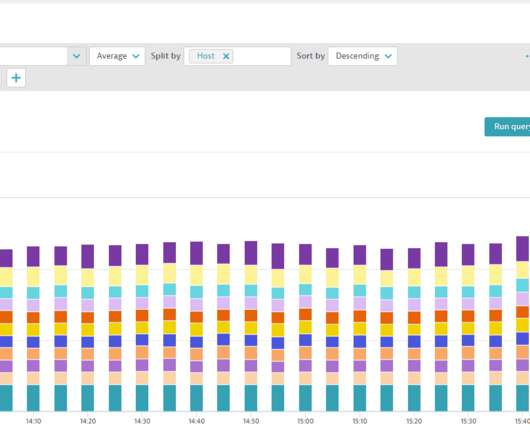
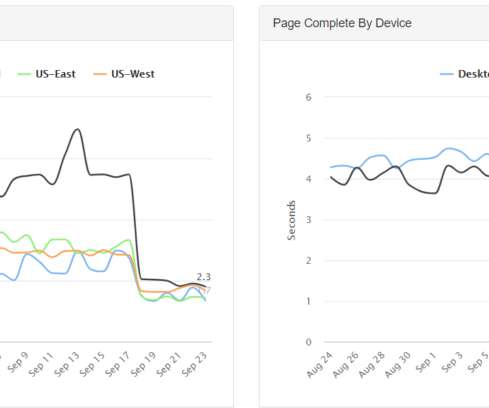
All systems at a glance A ready-to-use dashboard, straight out of the box, is the starting point, showing important information in a unified view. Default dashboard for IBM I monitoring The default dashboard provides an overview of all monitored systems and how many different entities are created by IBM i components.

article thumbnail

Privacy Spotlight: Easily comply with data subject rights in Dynatrace

Dynatrace

A dashboard summarizes relevant details, such as reference to the request and its status and alignment with any due date. When creating an export request, an authorized user specifies the end user’s details. The details are used to search Grail for any personal data related to that user.

Tuning 212
Insiders

Sign Up for our Newsletter

This site is protected by reCAPTCHA and the Google Privacy Policy and Terms of Service apply.

Trending Sources

article thumbnail

Unmatched scalability and security of Dynatrace extensions now available for all supported technologies: 7 reasons to migrate your JMX and Python plugins

Dynatrace

You can find extensions in Dynatrace Hub , activate them there, and instantly start monitoring the technologies and products you expect the Dynatrace platform to cover. These bundles ensure the provisioning of pre-configured dashboards, alerts, unified analysis views, and a topology model that relates metrics and entities.

article thumbnail

Citrix monitoring with Dynatrace: Easily observe your entire Citrix ecosystem

Dynatrace

This approach utilizes Dynatrace Digital Experience monitoring to observe each Citrix user’s activity in detail throughout each step of the session setup process. Alternatively, you can create your own dashboards and alerting profiles to ensure that your reporting aligns with your infrastructure and monitoring practices.

article thumbnail

Practical business process monitoring for real-time business observability

Dynatrace

The event source determines the configuration steps; see our business analytics documentation for details. Business Flow funnel view To get started with Business Flow, add the app from Dynatrace Hub and follow the setup guide. Getting started is simple. Define a business event for each milestone step.

article thumbnail

Get the insights you need for your F5 BIG-IP LTM

Dynatrace

F5 BIG-IP LTM dashboard This F5 BIG-IP LTM Overview dashboard shows all platform components with simple shortcuts to comprehensive lists for every entity type (instances, pools, pool members, virtual servers, disks, interfaces, traffic profiles, and rules). Example of an automatically generated dashboard for F5 instances.

Traffic 199
article thumbnail

Keeping an eye on your control plane is critical to ensuring the high availability and health of your self-managed OpenShift Container Platform

Dynatrace

The included dashboard is split into three main areas, displayed as rows. You don’t have all day to eyeball multiple dashboards. That’s why we’ve also included preconfigured alerts that draw your attention to the dashboard only when necessary. Simply go to Hub in the Dynatrace menu and search for “OpenShift.”