article thumbnail

AI-powered DNS request tracking extends infrastructure observability for high quality network traffic

Dynatrace

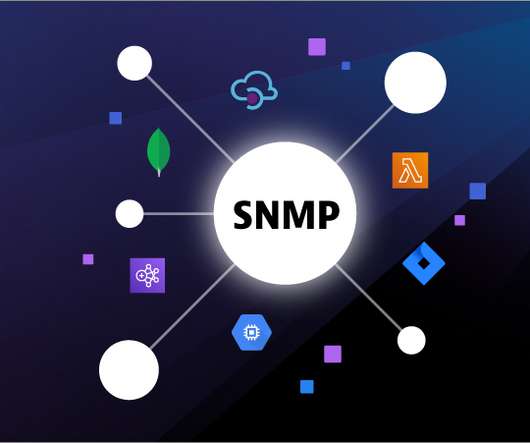
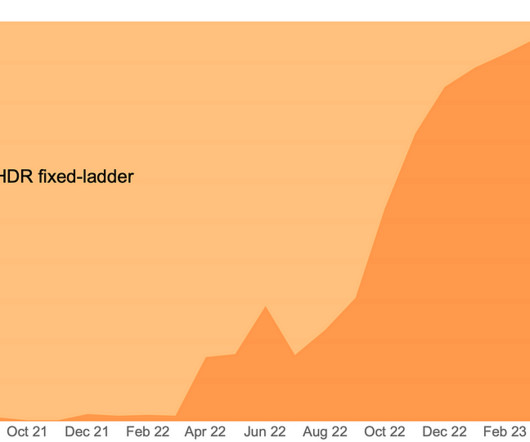
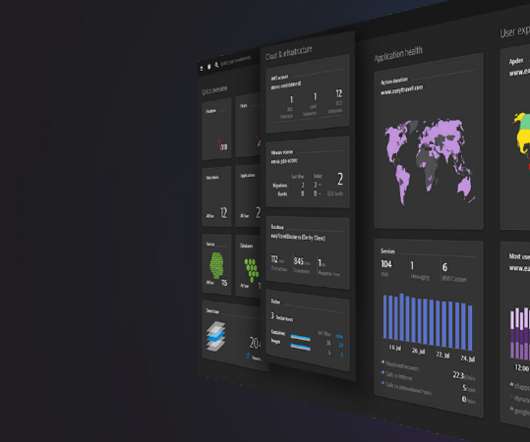
With all the data collected and powered by our Davis AI-driven causation engine, Dynatrace automatically identifies slowdowns in your applications and services and points you to their root cause. Ensure high quality network traffic by tracking DNS requests out-of-the-box. Network services visibility (DNS, NTP, ActiveDirectory).

Traffic 264
article thumbnail

Transform log data into actionable metrics and have Davis AI do the work for you

Dynatrace

Now, Dynatrace has the ability to turn numerical values from logs into metrics, which unlocks AI-powered answers, context, and automation for your apps and infrastructure, at scale. Whatever your use case, when log data reflects changes in your infrastructure or business metrics, you need to extract the metrics and monitor them.

Metrics 223
Insiders

Sign Up for our Newsletter

This site is protected by reCAPTCHA and the Google Privacy Policy and Terms of Service apply.

Trending Sources

article thumbnail

Core Web Vitals for Search Engine Optimisation: What Do We Need to Know?

CSS Wizardry

All Core Web Vitals data used to rank you is taken from actual Chrome-based traffic to your site. The Core Web Vitals Metrics Generally, I approve of the Core Web Vitals metrics themselves ( Largest Contentful Paint , First Input Delay , Cumulative Layout Shift , and the nascent Interaction to Next Paint ).

article thumbnail

Ensuring the Successful Launch of Ads on Netflix

The Netflix TechBlog

To do this, we devised a novel way to simulate the projected traffic weeks ahead of launch by building upon the traffic migration framework described here. New content or national events may drive brief spikes, but, by and large, traffic is usually smoothly increasing or decreasing.

Traffic 342
article thumbnail

Stream logs to Dynatrace with Amazon Data Firehose to boost your cloud-native journey

Dynatrace

Log data—the most verbose form of observability data, complementing other standardized signals like metrics and traces—is especially critical. Amazon Data Firehose helps stream logs to the right destination But your SREs and DevOps engineers know CloudWatch is not the terminal destination for data but rather an intermediate station.

Cloud 260
article thumbnail

Tutorial: Guide to automated SRE-driven performance engineering

Dynatrace

In this blog, I will be going through a step-by-step guide on how to automate SRE-driven performance engineering. Once Dynatrace sees the incoming traffic it will also show up in Dynatrace, under Transaction & Services. Dynatrace news. Keptn uses SLO definitions to automatically configure Dynatrace or Prometheus alerting rules.

article thumbnail

Site reliability done right: 5 SRE best practices that deliver on business objectives

Dynatrace

As a result, site reliability has emerged as a critical success metric for many organizations. Site reliability engineering (SRE) has recently become a critical discipline in recent years as the world has shifted in favor of web-based interactions. Mobile retail e-commerce spending in the U. Service-level objectives (SLOs).