Remove Demo Remove Design Remove Metrics Remove Speed
article thumbnail

Create compelling insights into business and operational KPIs through metric calculations in the Data explorer

Dynatrace

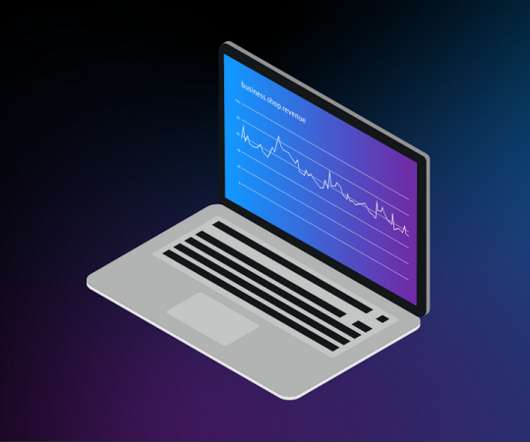
Metrics matter. But without complex analytics to make sense of them in context, metrics are often too raw to be useful on their own. To achieve relevant insights, raw metrics typically need to be processed through filtering, aggregation, or arithmetic operations. Examples of metric calculations. Dynatrace news.

Metrics 246
article thumbnail

Unlock the Power of DevSecOps with Newly Released Kubernetes Experience for Platform Engineering

Dynatrace

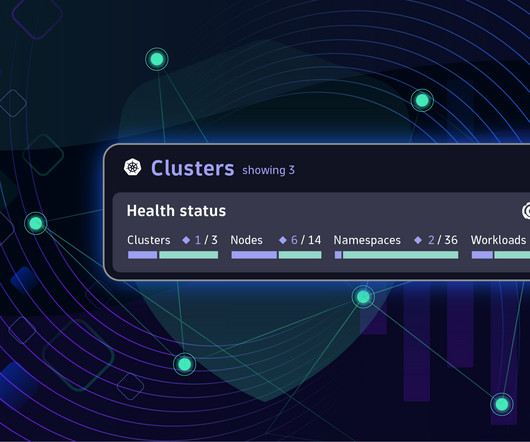
Provide self-service platform services with dedicated UI for development teams to improve developer experience and increase speed of delivery. Open source logs and metrics take precedence in the monitoring process. The ability to effectively manage multi-cluster infrastructure is critical to consistent and scalable service delivery.

Insiders

Sign Up for our Newsletter

This site is protected by reCAPTCHA and the Google Privacy Policy and Terms of Service apply.

Trending Sources

article thumbnail

Exploring Data @ Netflix

The Netflix TechBlog

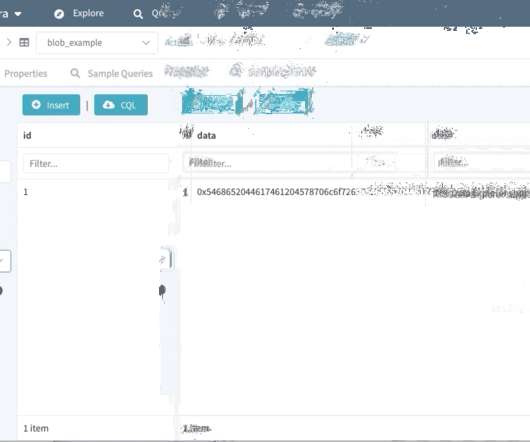
Dynomite is a high-speed in-memory database, providing highly available cross datacenter replication while preserving Redis-like semantics. Browsing your accessible clusters in different environments and regions Schema Designer Writing CREATE TABLE statements can be an intimidating experience for new Cassandra users.

Metrics 152
article thumbnail

Optimizing The Image Element LCP

Smashing Magazine

Largest Contentful Paint (or LCP) is one of three metrics of the Core Web Vitals. These metrics are used by Google to evaluate the quality of user experience. The images used in the article’s Codepen demonstrations will be integrated with TwicPics to save time in their creation and speed up the optimization of the LCP metric.

Media 105
article thumbnail

What is real user monitoring (RUM)?

Dynatrace

Real user monitoring collects data on a variety of metrics. For example, data collected on load actions can include navigation start, request start, and speed index metrics. Real user monitoring works by injecting code into an application to capture metrics while the application is in use. How real user monitoring works.

article thumbnail

Successful Kubernetes Monitoring – Three Pitfalls to Avoid

Dynatrace

Kubernetes was architected to allow for additional technologies and services to assist in speed, scalability and reducing the overall complexity which can arise from a Microservices environment. Today, most thought-leaders break down Observability into three pillars; metrics, distributed traces and logs. Don’t forget automation.

article thumbnail

A Guide To Image Optimization On Jamstack Sites

Smashing Magazine

Web performance refers to the speed at which a website loads, how fast it’s downloaded, and how an app is displayed on the user’s browser. Key user-centric metrics often depend on the size, number, layout, and loading priority of images on the page. Fixes To Common Problems. The Benefits Of Using An Image Service CDN. Conclusion.

Media 106