article thumbnail

New web performance insights with additional metrics and enhanced Visually complete for synthetic monitors

Dynatrace

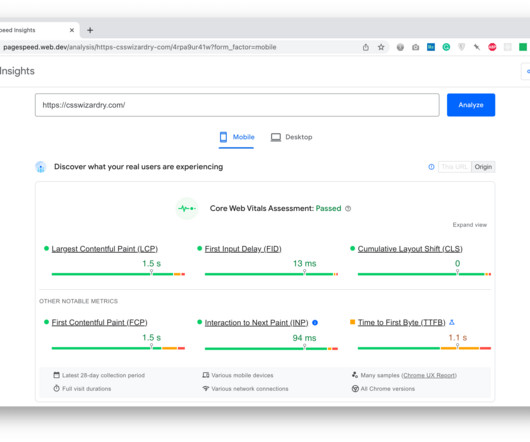
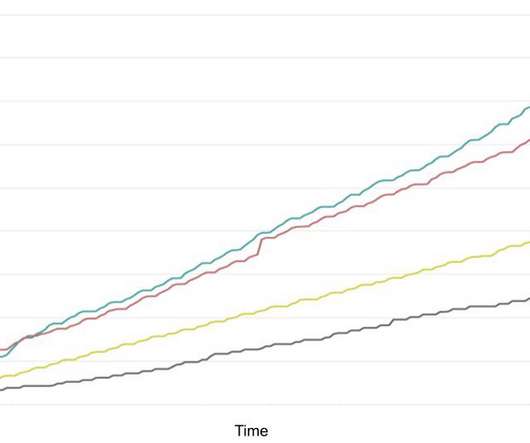
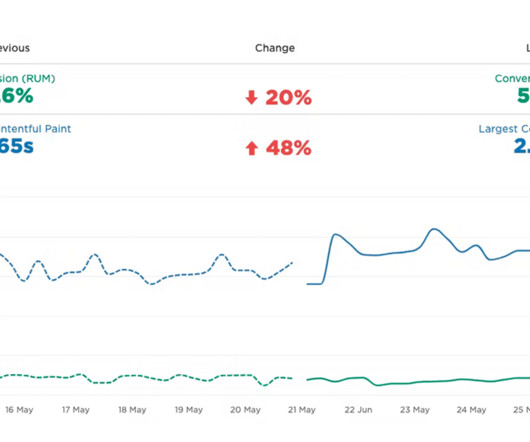
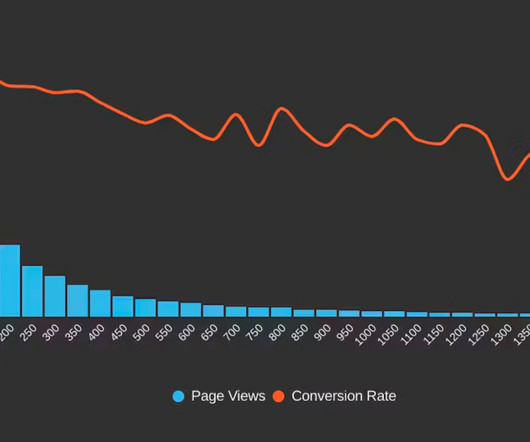
Recently introduced improvements to Visually complete and new web performance metrics for Real User Monitoring are now available for Synthetic Monitoring as well. Ensure better user experience with paint-focused performance metrics. These metrics are tightly connected to the perceived load speed of your application.

Metrics 207
article thumbnail

Running A Page Speed Test: Monitoring vs. Measuring

Smashing Magazine

Running A Page Speed Test: Monitoring vs. Measuring Running A Page Speed Test: Monitoring vs. Measuring Geoff Graham 2023-08-10T08:00:00+00:00 2023-08-10T12:35:05+00:00 This article is sponsored by DebugBear There is no shortage of ways to measure the speed of a webpage. Lighthouse results.

Speed 81
Insiders

Sign Up for our Newsletter

This site is protected by reCAPTCHA and the Google Privacy Policy and Terms of Service apply.

Trending Sources

article thumbnail

Core Web Vitals for Search Engine Optimisation: What Do We Need to Know?

CSS Wizardry

Google do strongly encourage you to focus on site speed for better performance in Search, but, if you don’t pass all relevant Core Web Vitals (and the applicable factors from the Page Experience report) they will not push you down the rankings. While Core Web Vitals can help with SEO, there’s so much more to site-speed than that.

article thumbnail

Radically speed up your code by fixing slow or frequent garbage collection

Dynatrace

To give you the definitive root cause of these issues, we’re happy to announce our continuous memory profiler , which allows you to easily see the actual method and execution tree that’s responsible for creating the objects that are responsible for slow or frequent garbage collection. . Speed up application code itself.

Speed 164
article thumbnail

Best of breed observability with Spring Micrometer and Dynatrace

Dynatrace

Spring also introduced Micrometer, a vendor-agnostic metric API with rich instrumentation options. Soon after, Dynatrace built a registry for exporting Micrometer metrics. Our data APIs, which ingest millions of metrics, traces, and logs per second, are reconciled using Micrometer-based metrics.

Metrics 190
article thumbnail

How To Benchmark And Improve Web Vitals With Real User Metrics

Smashing Magazine

How To Benchmark And Improve Web Vitals With Real User Metrics. How To Benchmark And Improve Web Vitals With Real User Metrics. Rest assured, all these definitions (and others) would be correct, provided the right context. Web performance is a broad topic with thousands of metrics that you could potentially monitor and improve.

article thumbnail

New SNMP platform extensions provide observability at scale for network devices

Dynatrace

framework , the SNMP extensions are a bundle of everything that’s needed (DataSource configuration, a dashboard template, a unified analysis page template, topology definition, entity extraction rules, relevant metric definitions and more) to get going with monitoring. Accelerated troubleshooting with topology awareness.

Network 203