article thumbnail

2023 Black Friday and Cyber Monday retail and e-commerce IT performance observations

Dynatrace

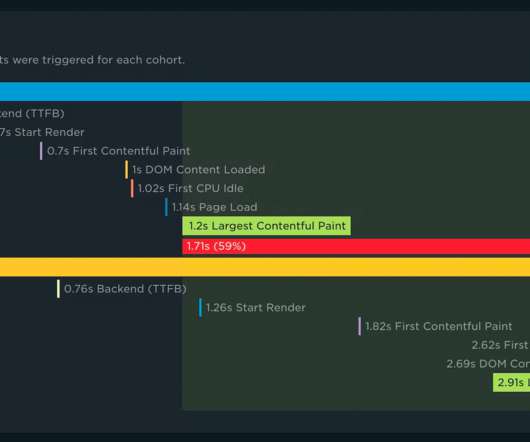
What was once an onslaught of consumer traffic between Black Friday and Cyber Monday has turned into a weeklong event, with most retailers offering deals well ahead of Black Friday. This had the effect of dramatically speeding up its performance and reducing support costs. Understanding what the end user is seeing is critical.

Retail 231
article thumbnail

Running A Page Speed Test: Monitoring vs. Measuring

Smashing Magazine

Running A Page Speed Test: Monitoring vs. Measuring Running A Page Speed Test: Monitoring vs. Measuring Geoff Graham 2023-08-10T08:00:00+00:00 2023-08-10T12:35:05+00:00 This article is sponsored by DebugBear There is no shortage of ways to measure the speed of a webpage. Lighthouse results. One type is called lab data.

Speed 81
Insiders

Sign Up for our Newsletter

This site is protected by reCAPTCHA and the Google Privacy Policy and Terms of Service apply.

Trending Sources

article thumbnail

Automated Change Impact Analysis with Site Reliability Guardian

Dynatrace

Other observability solutions don’t provide the required automation capabilities that would allow: Automating and speeding up the SLO validation process and quickly reacting to regressions detected in application topology. Davis will also assist Site Reliability Guardian in recommending relevant objectives and baselines for comparison.

DevOps 227
article thumbnail

The Speed of Time

Brendan Gregg

Since instances of both CentOS and Ubuntu were running in parallel, I could collect flame graphs at the same time (same time-of-day traffic mix) and compare them side by side. Measuring the speed of time Is there already a microbenchmark for os::javaTimeMillis()? The CentOS flame graph: The Ubuntu flame graph: Darn, they didn't work.

Speed 126
article thumbnail

Redis vs Memcached in 2024

Scalegrid

In this comparison of Redis vs Memcached, we strip away the complexity, focusing on each in-memory data store’s performance, scalability, and unique features. Introduction Caching serves a dual purpose in web development – speeding up client requests and reducing server load.

Cache 130
article thumbnail

NEW! RUM Compare dashboard

Speed Curve

With your RUM Compare dashboard, you can easily generate side-by-side comparisons for any two cohorts of data. Triage a performance regression related to the latest change or deployment to your site by looking at a before/after comparison. Evaluate CDN performance by exploring the impact of time-of-day traffic patterns.

Traffic 54
article thumbnail

New SNMP platform extensions provide observability at scale for network devices

Dynatrace

To help you speed up MTTR, there are several levels of visualization to help slice and dice through information: Instances. The built-in unified analysis pages offer real-time comparison of key performance indicators while applying a topology-first approach to the data. Pool nodes. Virtual servers. Interfaces.

Network 219