Remove Code Remove Event Remove Java Remove Monitoring
article thumbnail

How Java Profilers Work

DZone

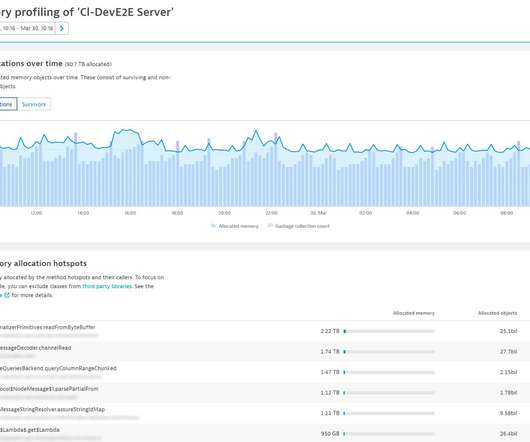
One of the best tools we have today for understanding application behavior and troubleshooting performance issues are Java profilers. Java profilers monitor JVM execution at the bytecode level and can provide information on thread execution and locks, heap memory usage, garbage collection, hot methods, exceptions, class loading, and more.

Java 100
article thumbnail

Radically speed up your code by fixing slow or frequent garbage collection

Dynatrace

Java Memory Management, with its built-in garbage collection, is one of the language’s finest achievements. However, garbage collection is one of the main sources of performance and scalability issues in any modern Java application. Optimize your code by finding and fixing the root cause of garbage collection problems.

Speed 165
Insiders

Sign Up for our Newsletter

This site is protected by reCAPTCHA and the Google Privacy Policy and Terms of Service apply.

Trending Sources

article thumbnail

Dynatrace and Red Hat expand enterprise observability to edge computing

Dynatrace

Application observability also helps to improve end-user experiences when combined with Dynatrace Digital Experience monitoring. Dynatrace customers can ingest data from sources like Prometheus and OpenTelemetry alongside data from Dynatrace OneAgent for automated Kubernetes monitoring. Signals are uniform, regardless of origin.

Retail 259
article thumbnail

Dynatrace automatically monitors OpenAI ChatGPT for companies that deliver reliable, cost-effective services powered by generative AI

Dynatrace

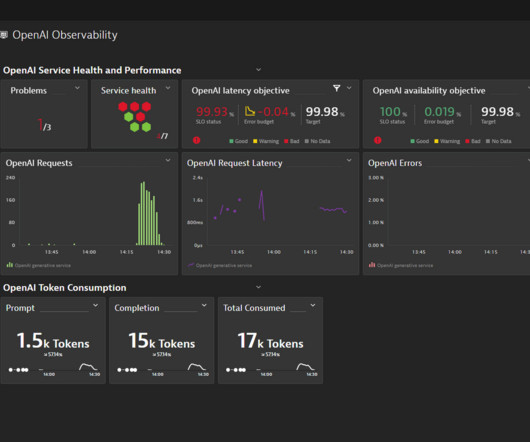
Dynatrace OneAgent ® discovers, observes, and protects access to OpenAI automatically, with no manual configuration, revealing the full context of used technologies, service interaction topology, security-vulnerability analysis, and the observability of all metrics, traces, logs, and business events in real time.

article thumbnail

Kubernetes Observability: Code Profiling With Flame Graphs

Percona

It shows which code paths are more busy on the CPU in given samples. Kubernetes limitations In Linux, by default, performance system events can’t be collected by unprivileged users. The documentation mentions that the supported languages to profile are Go, Java (any JVM-based language), Python, Ruby, and NodeJS.

Code 105
article thumbnail

Application observability meets developer observability: Unlock a 360º view of your environment

Dynatrace

But developers need code-level visibility and code-level data.” With traditional monitoring tools, the granular data that developers require typically involves manual preparation. That’s not how I envision code-level observability,” Laifenfeld said. KubeCon North America is this week.

article thumbnail

Understand and replay Android app crashes with Session Replay

Dynatrace

Instrumentation enables the shipment of a monitoring library with your app that collects telemetry data and sends it back to the Dynatrace platform for analysis. If you want an improved playback experience, we recommend that you capture custom events through the Session Replay API. Configure Session Replay for Android apps.