Remove Cache Remove Latency Remove Speed Remove Systems
article thumbnail

Consistent caching mechanism in Titus Gateway

The Netflix TechBlog

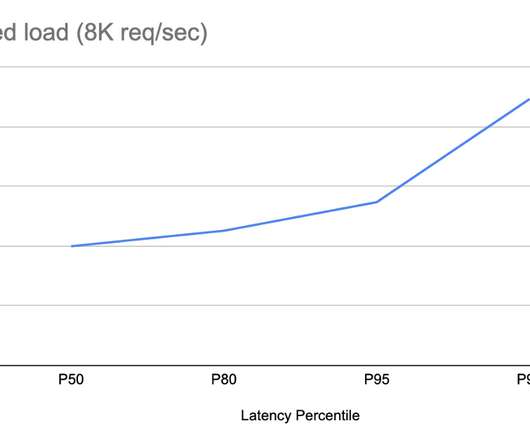
As the number of Titus users increased over the years, the load and pressure on the system increased substantially. We introduce a caching mechanism in the API gateway layer, allowing us to offload processing from singleton leader elected controllers without giving up strict data consistency and guarantees clients observe.

Cache 224
article thumbnail

Crucial Redis Monitoring Metrics You Must Watch

Scalegrid

Key Takeaways Critical performance indicators such as latency, CPU usage, memory utilization, hit rate, and number of connected clients/slaves/evictions must be monitored to maintain Redis’s high throughput and low latency capabilities. These essential data points heavily influence both stability and efficiency within the system.

Metrics 130
Insiders

Sign Up for our Newsletter

This site is protected by reCAPTCHA and the Google Privacy Policy and Terms of Service apply.

Trending Sources

article thumbnail

Redis vs Memcached in 2024

Scalegrid

Key Takeaways Redis offers complex data structures and additional features for versatile data handling, while Memcached excels in simplicity with a fast, multi-threaded architecture for basic caching needs. Redis is better suited for complex data models, and Memcached is better suited for high-throughput, string-based caching scenarios.

Cache 130
article thumbnail

Best practices and key metrics for improving mobile app performance

Dynatrace

User demographics , such as app version, operating system, location, and device type, can help tailor an app to better meet users’ needs and preferences. By monitoring metrics such as error rates, response times, and network latency, developers can identify trends and potential issues, so they don’t become critical.

article thumbnail

Redis® Monitoring Strategies for 2024

Scalegrid

Identifying key Redis® metrics such as latency, CPU usage, and memory metrics is crucial for effective Redis monitoring. With these essential support systems in place, you can effectively monitor your databases with up-to-date data about their health and functioning status at all times.

Strategy 130
article thumbnail

Answering Common Questions About Interpreting Page Speed Reports

Smashing Magazine

Answering Common Questions About Interpreting Page Speed Reports Answering Common Questions About Interpreting Page Speed Reports Geoff Graham 2023-10-31T16:00:00+00:00 2023-10-31T17:06:18+00:00 This article is sponsored by DebugBear Running a performance check on your site isn’t too terribly difficult. It’s right there in the name!

Speed 97
article thumbnail

Netflix Cloud Packaging in the Terabyte Era

The Netflix TechBlog

Lastly, the packager kicks in, adding a system layer to the asset, making it ready to be consumed by the clients. Uploading and downloading data always come with a penalty, namely latency. There are existing distributed file systems for the cloud as well as off-the-shelf FUSE modules for S3.

Cloud 237