Remove rendering-metrics
article thumbnail

Evaluating rendering metrics

Speed Curve

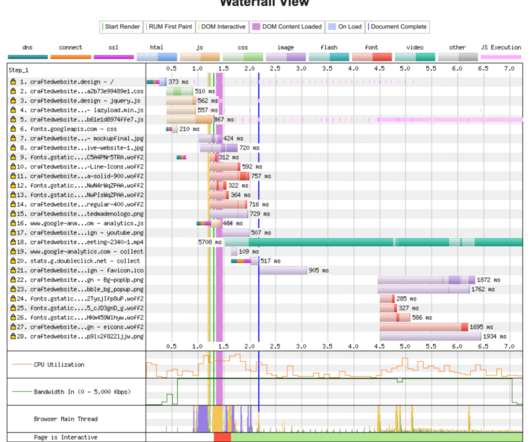
It's important that the critical content is downloaded and rendered before users get frustrated. Network metrics have been around for decades, but rendering metrics are newer. Start Render. These are a few of the rendering metrics that currently exist. A brief history of performance metrics.

Metrics 69
article thumbnail

Five ways cookie consent managers hurt web performance (and how to fix them)

Speed Curve

This can have an impact on most metrics – such as Start Render and Largest Contentful Paint – downstream. In this example, the synchronous requests for the CMP timed out, causing an extremely long delay in Start Render due to the SPOF. It's common to see the consent scripts blocking by design.

Insiders

Sign Up for our Newsletter

This site is protected by reCAPTCHA and the Google Privacy Policy and Terms of Service apply.

Trending Sources

article thumbnail

New web performance insights with additional metrics and enhanced Visually complete for synthetic monitors

Dynatrace

Recently introduced improvements to Visually complete and new web performance metrics for Real User Monitoring are now available for Synthetic Monitoring as well. Ensure better user experience with paint-focused performance metrics. These metrics are tightly connected to the perceived load speed of your application.

Metrics 223
article thumbnail

Business Insights extends support for optimizing Core Web Vitals

Dynatrace

In February 2021, Dynatrace announced full support for Google’s Core Web Vitals metrics , which will help site owners as they start optimizing Core Web Vitals performance for SEO. Dynatrace Business Insights views summarize top Core Web Vitals metrics and scores with 100% precision. Dynatrace news. 28-day lookbacks. 75 th percentile.

Traffic 264
article thumbnail

Software intelligence as code enables tailored observability, AIOps, and application security at scale

Dynatrace

But this is hard to achieve at scale: Development teams need specific insights into the microservices they are responsible for, reflecting particular metrics, dashboards, custom alerts, service-level objectives (SLOs), or even automatic remediation steps. , or “Did the last update cause the application issue or was it something else?”

Code 224
article thumbnail

Dynatrace AI predicts SLO violations and pinpoints root causes proactively

Dynatrace

However, such observation periods come with a disadvantage: incidents can pile up and there is a delay between those incidents and the corresponding health metrics ultimately dropping low enough to trigger a warning. Most monitoring tools offer only a single SLO metric. Get up and running in under a minute with SLO templates.

article thumbnail

Core Web Vitals: Practical metrics for optimal user experiences

Dynatrace

Metrics that offer measurable, repeatable insight into the user experience from the moment they arrive on a website from a mobile or desktop device. Great user experiences start with Core Web Vitals (CWVs) — a set of metrics defined by Google to help measure user experience at scale. When do these metrics matter?

Metrics 135