Remove javascript-long-tasks
article thumbnail

New! Vitals Dashboard

Speed Curve

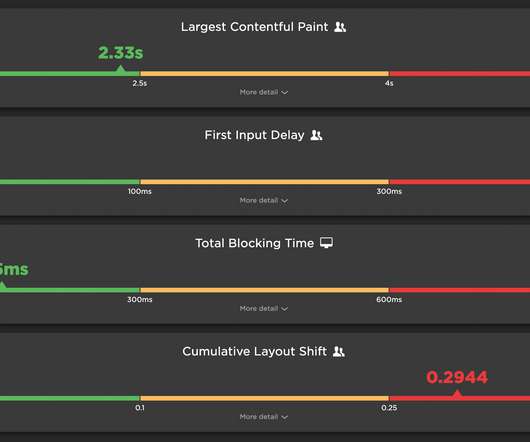
If you're just focusing on FID, you're likely putting your users at risk of suffering from a poor JavaScript-induced experience. We think there's a lot of value in looking at both Total Blocking Time and First Input Delay to get a better idea of how JavaScript is affecting your users. Keep reading this blog !

Education 110
article thumbnail

Evolution of Netflix Conductor:

The Netflix TechBlog

In this blog, we would like to present the latest updates to Conductor, address some of the frequently asked questions and thank the community for their contributions. Adoption As of writing this blog, Conductor orchestrates 600+ workflow definitions owned by 50+ teams across Netflix.

Lambda 189
Insiders

Sign Up for our Newsletter

This site is protected by reCAPTCHA and the Google Privacy Policy and Terms of Service apply.

Trending Sources

article thumbnail

Some Performance Links

CSS - Tricks

Just had a couple of good performance links burning a hole in my pocket, so blogging them like a good little blogger. Are your JavaScript long tasks frustrating users? That’s how long until any particular JavaScript task starts affecting user experience. Web Performance Recipes With Puppeteer.

article thumbnail

Seamlessly Swapping the API backend of the Netflix Android app

The Netflix TechBlog

Recently, we completed a year-long project rearchitecting and decoupling our backend from the centralized model used previously. Image taken from a previously published blog post As you can see, our code was just a part (#2 in the diagram) of this monolithic service. These paths, along with some other configuration, builds a Task.

Latency 233
article thumbnail

Getting started with web performance? Here's what you need to focus on.

Speed Curve

The critical rendering path is the set of steps browsers must take to convert HTML, CSS and JavaScript into living, breathing websites. To optimize for performance, you need to understand what happens in the steps between receiving the HTML, CSS, and JavaScript bytes and the processing that's required to turn them into rendered pixels.

article thumbnail

The DevTools Performance Tab – Using Chrome’s Profiler to Optimize Your Page Speed

MachMetrics

By default, the recording will show all of the call stacks from Javascript functions that occurred during the recording. The [warning] messages in show long-running tasks and code that may potentially block page rendering. Some common issues to look for: Don’t write JavaScript that forces the browser to recalculate layout.

Speed 99
article thumbnail

10 things I love about SpeedCurve (that I think you'll love, too)

Speed Curve

With SpeedCurve RUM , you can create correlation charts that show you the relationship between performance metrics – from start render and LCP to page metrics like image and JavaScript size. Have they got more JavaScript? You can also add you own data, such as conversion rate and cart size, so you can create custom chart types.