Remove Benchmarking Remove Best Practices Remove Retail Remove Testing
article thumbnail

Performance audit: Lego.com

Speed Curve

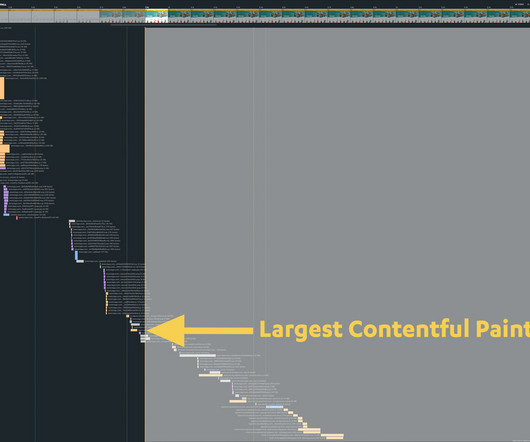
Background For this performance audit, I looked at this synthetic test for the LEGO.com home page. (We We track LEGO.com, along with a handful of other leading ecommerce sites, in our public-facing Retail Benchmarks dashboard , which I encourage you to check out. Let's dig deeper. seconds, LCP lags at 3.96

article thumbnail

2022 in review: New dashboards, Core Web Vitals enhancements, third-party tracking & more!

Speed Curve

Expanded our test agent locations to bring you even more places to test from worldwide. Your current competitive benchmarks status. As you may already know, we run full Lighthouse audits on every page you test in synthetic. Expanded Industry Speed Benchmarks. The current status of your performance budgets.

Insiders

Sign Up for our Newsletter

This site is protected by reCAPTCHA and the Google Privacy Policy and Terms of Service apply.

Trending Sources

article thumbnail

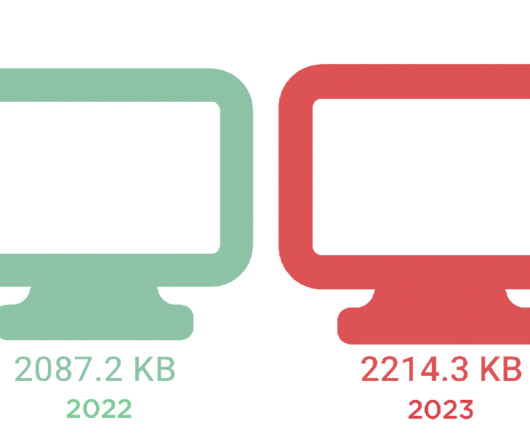
Ten years of page bloat: What have we learned?

Speed Curve

And if that already wasn’t enough, the number of images on a page has been linked to lower conversion rates on retail sites. These numbers should not be taken as a benchmark for your own site. You can see this by looking at the synthetic test result for Sears.com (again, available via our Industry Benchmarks ).

Mobile 145
article thumbnail

2021 in review: It was a big year!

Speed Curve

We apply this litmus test to everything we do, and I believe it's the secret of our success. We've made LCP events easy to spot by highlighting them in your Vitals dashboard, your test details, and your Sites dashboard, where you'll also see how key metrics are trending over time. Performance Culture Best Practices.

Retail 52
article thumbnail

An Opinionated Guide to Performance Budgets

Speed Curve

You can then configure your monitoring tools to send you alerts – or even break the build, if you're testing in your staging environment – when your budgets are violated. The tricky part comes when you try to put them into practice. The easiest way to do this is to look at rendering filmstrips in your synthetic test data.

article thumbnail

Google PageSpeed Insights - Scoring 100/100 with WordPress

KeyCDN

Running speed tests with tools like Google PageSpeed Insights , WebPageTest , or KeyCDN’s Website Speed Test are always a good way to help gauge your website’s performance. According to Google, the best practice for a website’s speed is to keep it under 3 seconds load time.

Google 103
article thumbnail

A Complete Guide to Performance Budgets

Speed Curve

You can then configure your monitoring tools to send you alerts – or even break the build, if you're testing in your staging environment – when your budgets are violated. Use synthetic testing to visually validate your metrics The metrics mentioned above are not hard-and-fast suggestions.