Remove Benchmarking Remove Best Practices Remove Metrics Remove Retail
article thumbnail

What is FinOps? How to keep cloud spend in check

Dynatrace

Today, many global industries implement FinOps, including telecommunications, retail, manufacturing, and energy conservation, as well as most Fortune 50 companies. This practice isn’t just about reducing costs. FinOps aims to support the best cloud spend that maximizes the value of all necessary computing resources.

Cloud 201
article thumbnail

Performance audit: Lego.com

Speed Curve

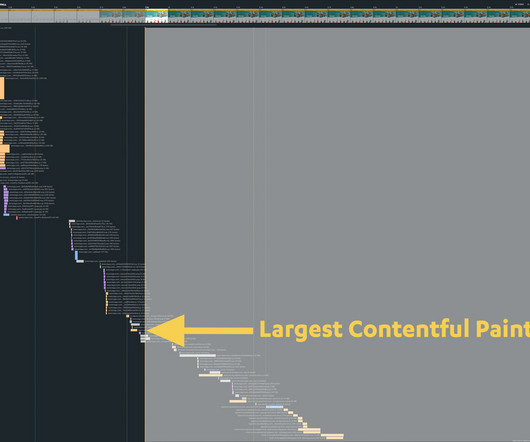
We track LEGO.com, along with a handful of other leading ecommerce sites, in our public-facing Retail Benchmarks dashboard , which I encourage you to check out. It shows how key metrics align with the rendering timeline (the filmstrip view at the top of the chart). This is a high-level waterfall for the LEGO.com home page.

Insiders

Sign Up for our Newsletter

This site is protected by reCAPTCHA and the Google Privacy Policy and Terms of Service apply.

Trending Sources

article thumbnail

2022 in review: New dashboards, Core Web Vitals enhancements, third-party tracking & more!

Speed Curve

You can see at a glance: Key metrics like Core Web Vitals and your User Happiness score. Your current competitive benchmarks status. Here you can still find time series charts that show how performance is trending over time across a number of key metrics, including Core Web Vitals. Expanded Industry Speed Benchmarks.

article thumbnail

Ten years of page bloat: What have we learned?

Speed Curve

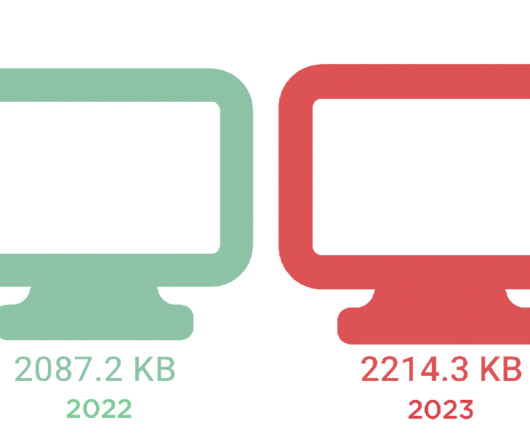
How does page bloat affect other metrics, such as Google's Core Web Vitals? And if that already wasn’t enough, the number of images on a page has been linked to lower conversion rates on retail sites. These numbers should not be taken as a benchmark for your own site. How does page bloat hurt your business?

Mobile 145
article thumbnail

An Opinionated Guide to Performance Budgets

Speed Curve

Web pages are unbelievably complex, and there are hundreds of different metrics available to track. A performance budget is a threshold that you apply to the metrics you care about the most. This is when you run into three important questions: Which metrics should you focus on? Which metrics should you focus on?

article thumbnail

2021 in review: It was a big year!

Speed Curve

We've been tracking these as individual metrics – Largest Contentful Paint, First Input Delay, and Cumulative Layout Shift – since before Google branded them as a set. Your Sessions dashboard lets you drill down and segment your RUM data by: Metric / duration. Performance Culture Best Practices. Time period.

Retail 52
article thumbnail

A Complete Guide to Performance Budgets

Speed Curve

A performance budget is a threshold that you apply to the metrics you care about the most. A good performance budget chart, such as the one above, should show you: The metric you're tracking The threshold you've created for that metric When you exceed that threshold How long you stayed out of bounds When you returned to below the threshold 3.