Remove Availability Remove Data Remove Latency Remove Servers
article thumbnail

Comparing Approaches to Durability in Low Latency Messaging Queues

DZone

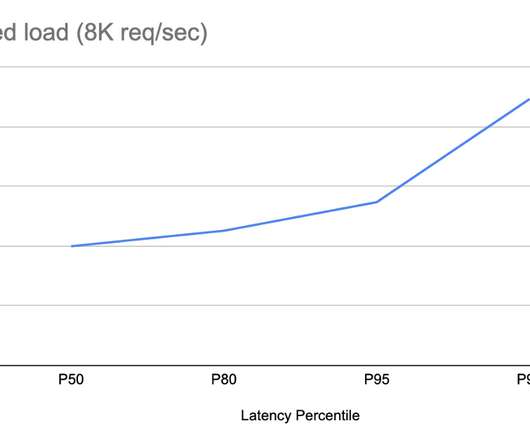
A significant feature of Chronicle Queue Enterprise is support for TCP replication across multiple servers to ensure the high availability of application infrastructure. Little’s Law and Why Latency Matters. In many cases, the assumption is that as long as throughput is high enough, the latency won’t be a problem.

Latency 275
article thumbnail

Dynatrace Managed turnkey Premium High Availability for globally distributed data centers (Early Adopter)

Dynatrace

Dynatrace Managed is intrinsically highly available as it stores three copies of all events, user sessions, and metrics across its cluster nodes. The network latency between cluster nodes should be around 10 ms or less. Near-zero RPO and RTO—monitoring continues seamlessly and without data loss in failover scenarios.

Insiders

Sign Up for our Newsletter

This site is protected by reCAPTCHA and the Google Privacy Policy and Terms of Service apply.

Trending Sources

article thumbnail

MongoDB Rollback: How to Minimize Data Loss

Scalegrid

When a MongoDB rollback happens, it can cause trouble to your data integrity and system consistency. Understanding how to address a rollback is critical for minimizing potential data loss and maintaining seamless operations. The consequences of rollbacks are significant and should not be underestimated.

Database 130
article thumbnail

The Power of Caching: Boosting API Performance and Scalability

DZone

Caching is the process of storing frequently accessed data or resources in a temporary storage location, such as memory or disk, to improve retrieval speed and reduce the need for repetitive processing. Bandwidth optimization: Caching reduces the amount of data transferred over the network, minimizing bandwidth usage and improving efficiency.

Cache 246
article thumbnail

Bending pause times to your will with Generational ZGC

The Netflix TechBlog

Reduced tail latencies In both our GRPC and DGS Framework services, GC pauses are a significant source of tail latencies. That’s particularly true of our GRPC clients and servers, where request cancellations due to timeouts interact with reliability features such as retries, hedging and fallbacks.

Latency 228
article thumbnail

Crucial Redis Monitoring Metrics You Must Watch

Scalegrid

You will need to know which monitoring metrics for Redis to watch and a tool to monitor these critical server metrics to ensure its health. Understanding Redis Performance Indicators Redis is designed to handle high traffic and low latency with its in-memory data store and efficient data structures.

Metrics 130
article thumbnail

The road to observability demo part 3: Collect, instrument, and analyze telemetry data automatically with Dynatrace

Dynatrace

OpenTelemetry , the open source observability tool, has become the go-to standard for instrumenting custom applications to collect observability telemetry data. For this third and final part of our series, we saved the best for last: How you can enhance telemetry data even more and with less effort on your end with Dynatrace OneAgent.

Metrics 176