article thumbnail

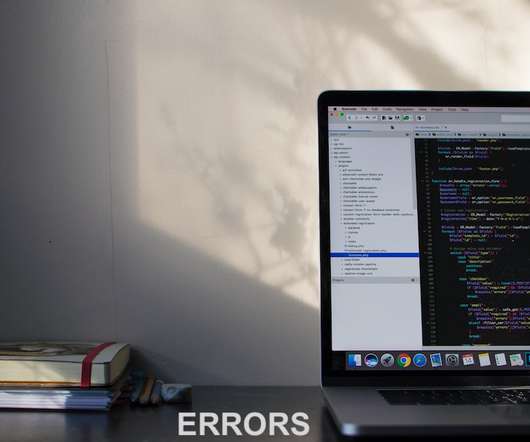
C# Errors by Example: Checking the DotNetNuke CMS

DZone

Today, we discuss C# code quality and a variety of errors by the example of CMS DotNetNuke. We're going to dig into its source code. The source code is available on GitHub. You're going to need a cup of coffee. DotNetNuke. DotNetNuke is an open-source content management system (CMS) written mainly in C#.

C++ 256
article thumbnail

Find vulnerabilities in your code—don’t wait for someone to exploit them

Dynatrace

All-new Dynatrace code-level vulnerability detection All-new Dynatrace code-level vulnerability detection evaluates all requests passing through your applications to identify vulnerabilities. The deep insights into application code provided by OneAgent® help track potentially vulnerable data flow within an application.

Code 210
Insiders

Sign Up for our Newsletter

This site is protected by reCAPTCHA and the Google Privacy Policy and Terms of Service apply.

Trending Sources

article thumbnail

Debugging MySQL Core File in Visual Studio Code

Percona

Visual Studio Code (VS) supports memory dump debugging via C/C++ extension: [link]. When MySQL generates a core file, the VS code simplifies the process of debugging. This blog will discuss how to debug the core file in VS code. Downloading the source code You can download the source code from GitHub.

Code 102
article thumbnail

Kubernetes Observability: Code Profiling With Flame Graphs

Percona

It shows which code paths are more busy on the CPU in given samples. An example of a flame graph can be found below: Each box is a function in the stack, and wider boxes mean more time the system was busy on CPU on these functions. An example is kubectl-flame ( [link] ). ✔ Launching profiler. ✔ Profiling.

Code 110
article thumbnail

The right person at the right time makes all the difference: Best practices for ownership information

Dynatrace

The automated extraction of ownership information, for example, from Kubernetes annotations, is therefore essential. Keeping ownership teams and their properties up to date is essential, as is having the right contact information available when needed. An example via Monaco can be found in this public GitHub repository.

article thumbnail

Analyze all AWS data in minutes with Amazon CloudWatch Metric Streams available in Dynatrace

Dynatrace

Thanks to centralized configuration, near real-time availability of all services, and potential cost optimization, metric streaming is now the future of performance data distribution. tenant_url – URL of your Dynatrace SaaS environment, for example [link]. Here you can see an example of a created stack.

AWS 156
article thumbnail

Radically speed up your code by fixing slow or frequent garbage collection

Dynatrace

It prevents your application from fully leveraging the available CPU. Optimize your code by finding and fixing the root cause of garbage collection problems. These details arm you with the knowledge necessary to find the respective code and remove unnecessary allocations. This resource is not available to your application. .

Speed 167