Remove Analytics Remove Infrastructure Remove Monitoring Remove Scalability
article thumbnail

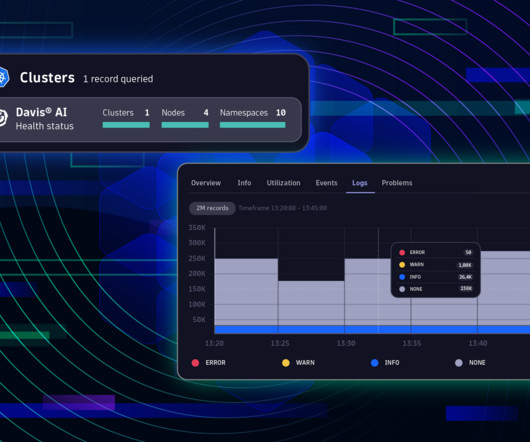
Unlock log analytics: Seamless insights without writing queries

Dynatrace

Logs provide answers, but monitoring is a challenge Manual tagging is error-prone Making sure your required logs are monitored is a task distributed between the data owner and the monitoring administrator. Often, it comes down to provisioning YAML configuration files and listing the files or log sources required for monitoring.

Analytics 176
article thumbnail

Easily monitor IBM i with updated Dynatrace extension

Dynatrace

It is based on the IBM AS/400 system and is known for its reliability, scalability, and security features. It’s all monitored remotely ! Default dashboard for IBM I monitoring The default dashboard provides an overview of all monitored systems and how many different entities are created by IBM i components.

Insiders

Sign Up for our Newsletter

This site is protected by reCAPTCHA and the Google Privacy Policy and Terms of Service apply.

Trending Sources

article thumbnail

What is IT operations analytics? Extract more data insights from more sources

Dynatrace

With 99% of organizations using multicloud environments , effectively monitoring cloud operations with AI-driven analytics and automation is critical. IT operations analytics (ITOA) with artificial intelligence (AI) capabilities supports faster cloud deployment of digital products and services and trusted business insights.

Analytics 193
article thumbnail

Any analysis, any time: Dynatrace Log Management and Analytics powered by Grail

Dynatrace

Log management and analytics is an essential part of any organization’s infrastructure, and it’s no secret the industry has suffered from a shortage of innovation for several years. Current analytics tools are fragmented and lack context for meaningful analysis. Effective analytics with the Dynatrace Query Language.

Analytics 240
article thumbnail

Unmatched scalability and security of Dynatrace extensions now available for all supported technologies: 7 reasons to migrate your JMX and Python plugins

Dynatrace

that offers security, scalability, and simplicity of use. already address SNMP, WMI, SQL databases, and Prometheus technologies, serving the monitoring needs of hundreds of Dynatrace customers. JMX monitoring extensions are currently being migrated. Extensions can monitor virtually any type of technology in your environment.

article thumbnail

Flexible, scalable, self-service Kubernetes native observability now in General Availability

Dynatrace

To solve this problem , Dynatrace offers a fully automated approach to infrastructure and application observability including Kubernetes control plane, deployments, pods, nodes, and a wide array of cloud-native technologies. None of this complexity is exposed to application and infrastructure teams.

article thumbnail

Google Cloud Next 2024: AI innovation for Google Cloud

Dynatrace

As organizations continue to expand within cloud-native environments using Google Cloud, ensuring scalability becomes a top priority. Dynatrace offers essential analytics and automation to keep applications optimized and businesses flourishing. Learn to boost system reliability through proactive issue detection.

Google 267