article thumbnail

OpenTelemetry services analysis and endpoint detection made easier with Dynatrace unified services

Dynatrace

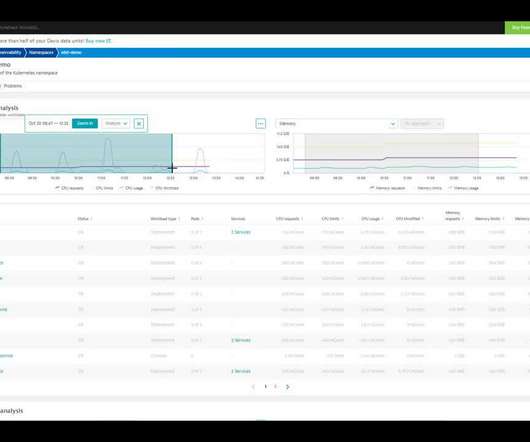
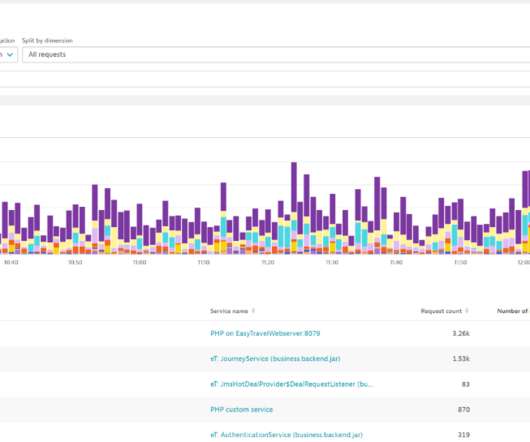
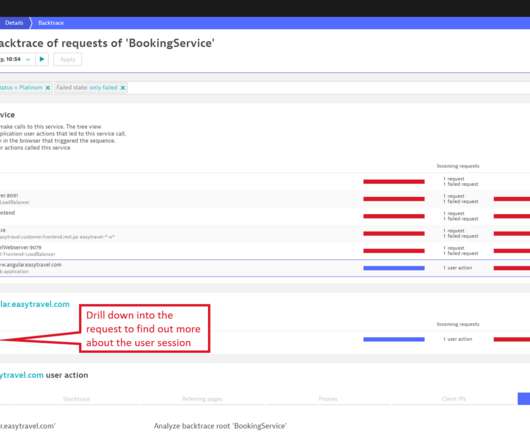
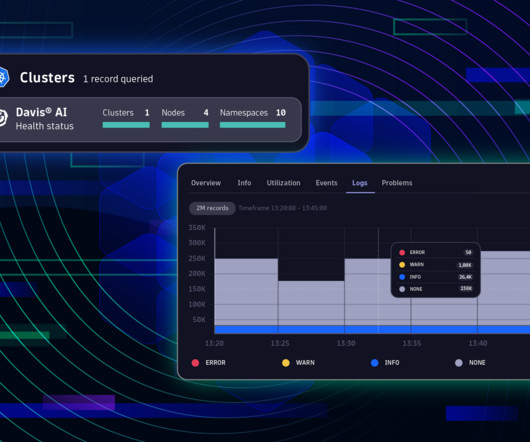
A unified platform approach also makes OpenTelemetry data available to more teams across the organization for more diversified analysis. By automatically detecting these OpenTelemetry endpoints, Davis AI adds the endpoints to its service list for analysis and alerting with no additional setup or configuration required.

Metrics 171
article thumbnail

Prevent potential problems quickly and efficiently with Davis exploratory analysis

Dynatrace

Just one click to your preventive analysis. Dynatrace now goes a step further and makes it possible for SREs and DevOps to perform proactive exploratory analysis of observability signals with intelligent answers. With Davis exploratory analysis we can now automatically analyze thousands of signals before incidences even arise.

Insiders

Sign Up for our Newsletter

This site is protected by reCAPTCHA and the Google Privacy Policy and Terms of Service apply.

Trending Sources

article thumbnail

Conducting log analysis with an observability platform and full data context

Dynatrace

Modern organizations ingest petabytes of data daily, but legacy approaches to log analysis and management cannot accommodate this volume of data. Traditional log analysis evaluates logs and enables organizations to mitigate myriad risks and meet compliance regulations. Grail enables 100% precision insights into all stored data.

Analytics 193
article thumbnail

Multidimensional analysis 2.0: Analyze, chart, and report on microservices-based metrics without code changes

Dynatrace

Dynatrace customers have the ability to leverage PurePath distributed tracing functionality in driving adhoc multidimensional analysis (MDA) on any kind of data available within their microservices. A larger financial institution is using the analysis to report business metrics on dashboards and make them accessible via the Dynatrace API.

Metrics 161
article thumbnail

Why applying chaos engineering to data-intensive applications matters

Dynatrace

The following are key insights from our extensive experimental analysis: Flink, Kafka Streams, and Spark Structured Streaming are resilient to different types and degrees of failure. From the Kafka Streams community, one of the configurations mostly tuned in production is adding standby replicas. Recovery time of the latency p90.

article thumbnail

Multidimensional analysis 2.0: Analyze microservice-based metrics without code changes (Part 2)

Dynatrace

In Part 1 of this blog series , we presented a few Dynatrace customer use cases for multidimensional analysis. To start your analysis, select Diagnostic tools from the navigation menu and select Multidimensional analysis. To find out, select the Backtrace button at the top-right corner of the Failure analysis page (see below).

Metrics 166
article thumbnail

An approach to index tuning – Part 2

SQL Performance

In my last post , I started to outline the process I go through when tuning queries – specifically when I discover that I need to add a new index, or modify an existing one. This is where index tuning becomes an art. It's a lot friends, which is why it's ironic that I initially thought about stating that index tuning was easy.

Tuning 137