
For most who work in the retail sector, the pandemic has been an unwelcome test of our ability to cope with disruption. Shops closed, shifting apparel and home goods shopping to online marketplaces. Dining out became eating in; restaurants pivoted to takeout and delivery while interest in subscription meal kits spiked. Overnight, grocery shopping became an online sport supported by new pickup and delivery options. Some eye-opening statistics:
- In March, online sales increased by 63%, signaling an unprecedented shift to digital channels. (Source: SAP)
- In eight months, retailers offering curbside pickup increased from 7% to 44%, reflecting rapidly changing consumer preferences. (Source: Digital Commerce 360)
- Since February, 75% of U.S. consumers have tried new brands or outlets, pointing to diminishing loyalty. (Source: McKinsey)
Within all this disruption, however, lies opportunity. Retailers agile enough to pivot and meet customer experience expectations stand to increase loyalty and gain lasting market share.
Millions of customers are up for grabs
More people are shopping through digital channels. Online shopping “newbies,” your once-loyal customers, and your competitors’ customers are all up for grabs. And you can bet your marketing team is trying to attract them—in greater numbers—to your online store. Simultaneously, you’re constantly optimizing your website to meet your customers’ changing priorities. Beyond the obvious—right product, right price, right time—how do you capture them? How do you gain—or regain—their loyalty?
A digital mantra
To answer this, McKinsey repeats what is by now a digital mantra: ensure that the digital experience is truly “zero friction.” Customer experience leaders experience shallower downturns and recover faster than laggards.
While awesome experiences begin even before visitors land at your site, the purchase funnel is where optimization towards “frictionless” becomes critical. Potential customers have an intent to purchase—until something interferes. Are the steps intuitive? Do pages load quickly and without error, whether web or mobile? Are there points where users get frustrated and backtrack or abandon? These are, of course, important questions. And it’s in answering these questions where IT and business traditionally have diverged.
Yesterday’s nice-to-have is today’s must-have
It was never ideal to rely exclusively on business intelligence or web analytics tools to discover poor business outcomes caused by friction in the purchase funnel. Delays in reporting and analysis cost precious time (and customers), while the tools’ relatively narrow focus often obscures the importance of user experience, missing the “why” behind the “what.” When indicators did point to poor user experience, the diagnostic handoff from business to IT was inefficient; different terminology, different metrics, and an often-defensive posture introduced additional delays. As a result, collaboration between business, development, and operations teams tended to be infrequent and reactive, with little focus on the resulting negative business impact. It was the opposite of agile, a costly and unnecessary division even in the best of times.
The good news is that it’s easy—as a Dynatrace customer—to include your business goals and metrics on your Dynatrace dashboards. You’ll gain real-time business insights and automatic AI-assisted answers. You’ll benefit through ad hoc analytics to drive real-time collaboration. You’ll position your organization to emerge from the pandemic as an agile customer-centric leader.
Inspirational dashboards: Imagining the possibilities
In previous blogs, we’ve shown easy ways to add business metrics and audience segments—manually, through the Adobe Analytics property pack, and using the Configurator tool. These approaches emphasize extracting data from user sessions, one of the more commonly used sources of business analytics metrics; additional sources include server-side data, logs, and external metrics. Leveraging user session data simplifies the process of creating business analytics dashboards; the KPIs your business teams care about are generally already well-defined in your website’s data layer and used in parallel by web analytics reporting tools.
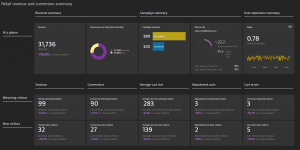
Let’s illustrate a simple use case for a retail outlet. Revenue is the business goal, and KPIs supporting this goal include the number of site visitors, average cart size, and conversions (purchases). The marketing team has two campaigns running, intending to attract first-time users. The dashboard below gives IT a real-time business perspective into the health of the business they support. Dynatrace will let you know when sessions or conversion rates drop, when abandoned carts or cart errors increase, or if a campaign suddenly stops performing. You’ll see how first-time visitors engage; how does this cohort’s conversion rate compare with returning visitors?
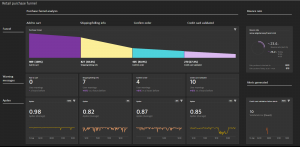
Let’s continue by drilling into the purchase funnel details. While some abandonment at each funnel step is to be expected, reducing the abandonment rate will increase conversions and therefore revenue. By adding the context of user experience—Apdex in our example—you can prioritize the actions you take when poor experience impacts conversion rates.
Many customers also choose to include user warnings or error messages on their business analytics dashboards, especially when they introduce friction. These warnings might be informational (“Promotion code not valid”) or they may indicate a service issue (“Sorry, no delivery slots are available”).
Sharing KPIs and terminology with your business peers fosters collaboration. Leveraging Dynatrace’s automation, scalability, and Davis® AI, you’ll know immediately how user experience, application performance, and errors affect conversions and business outcomes—and exactly where to focus your optimization efforts for the biggest impact.
Remember the revenue goal: Improving business outcomes
Timely cross-discipline insights provide the foundation for data-driven troubleshooting and optimization, whether your concern is website performance, campaign messaging, or the user journey through the purchase funnel. Dynatrace delivers the scale, automation, and AI to keep you innovating and improving business outcomes instead of configuring and maintaining tools.
Check out this on-demand webinar to see how Mitchells & Butlers, the UK’s largest operators of pubs, restaurants, and bars, used Dynatrace to put agility into action by enhancing customer experiences, quickly realizing higher cart values for mobile app purchases.
To learn more, or to get started on your own business analytics journey, contact your account team, Dynatrace One, our Business Insights team, or request a personalized demo.


Looking for answers?
Start a new discussion or ask for help in our Q&A forum.
Go to forum