
Dynatrace Log Monitoring is now enhanced with advanced processing, making the data locked in logs actionable and completing the observability picture on the Dynatrace platform. Easy-to-use pattern matching lets you extract any data from logs, transform and manipulate attributes, and filter or drop insignificant logs.
The data locked in your log files can be a goldmine for your application developers, operations teams, and your enterprise as a whole. However, it can be complicated, expensive, or even impossible to set up robust observability that makes use of this data.
For example:
- Infrastructure services might provide data about request timings that can give you a precise overview of system health, but the data is logged in a custom format. Even worse, if your service logs record critical events such as errors in a non-standard way, those errors might go unnoticed by your observability team.
- Business application logs bring visibility into your user and transaction flows. From reacting to keywords that signal special offers, browsing the latest products, adding items to the shopping cart, checking out, and handling shipping, all the details of each user journey is available in logs. Though analysts and management can’t make use of this log data if it’s formatted with custom keywords or IDs that can’t be mapped to a dashboard or report for further analysis.
Log Monitoring Classic
Log Monitoring Classic is available for SaaS and managed deployments. For the latest Dynatrace log monitoring offering on SaaS, upgrade to Log Management and Analytics.
Log format inconsistency makes it a challenge to access critical data
Overcoming these issues can be complex and expensive in terms of additional time and effort. Pre-formatting and unifying data with domain-related attributes on-source where the info is logged, might require software reconfiguration or even be impossible. Deploying log shippers that are expressly set up to reformat logs before they’re sent to the observability tool increases overhead and complexity. This also adds requirements for maintenance, decreases time to market for new services, blurs the observability picture, and ultimately holds you back from making data-driven decisions.
Log files provide an unparalleled level of detail about the performance of your software. Whether a web server, mobile app, backend service, or other custom application, log data can provide you with deep insights into your software’s operations and events. When log data is granularly structured in JSON format, it’s fairly easy to extract and observe these details. For example, Dynatrace recently introduced the extraction of log-based metrics for JSON logs.
But there’s a catch: there’s no universally guaranteed format and structure for logs. For example, Apache access logs store each event as a single line while Java debug logs store each individual event across multiple lines. FortiGate traffic logs store data elements in key-value pairs while NGINX custom access logs store events in arrays. Add multi-event logs (think OpenLDAP access logs), multi-application logs (like Linux Syslog), nested JSONs, and CSV logs to the mix and the complexity becomes overwhelming.
Advanced processing on your observability platform unlocks the full value of log data
Dynatrace now includes powerful log-processing capabilities for all types of log data. These capabilities make your log data actionable directly on the Dynatrace platform without requiring additional log preprocessors, shippers, handlers, or other software overhead.
Log data is processed on ingest, whether coming from a fleet of OneAgents deployed across your enterprise hosts or generic API ingest from cloud services. Formatting in single- or multi-line logs, key-value pairs or arrays, nested JSON, or CSVs is no longer an obstacle to making your log data actionable in your observability mission.
Log processing enables:
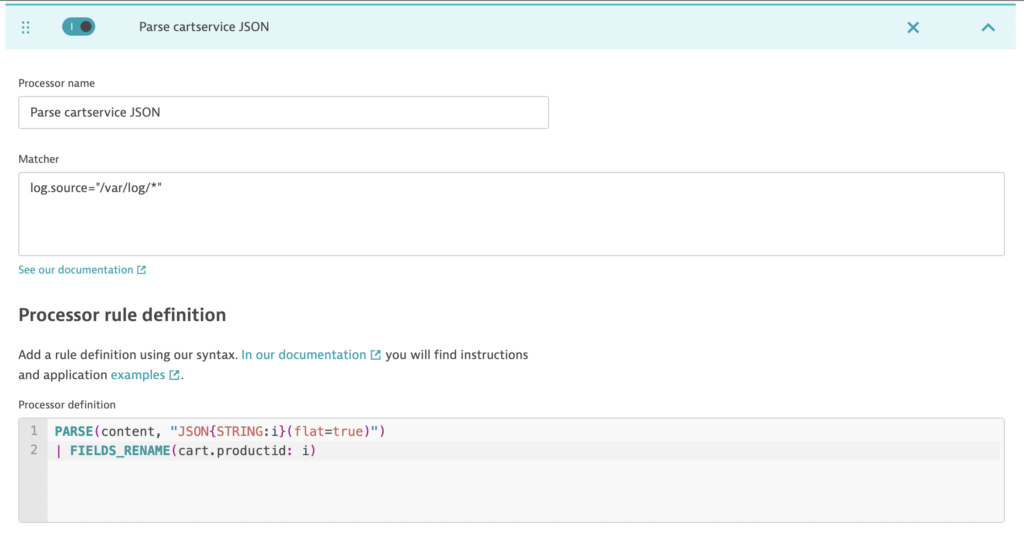
- Extraction of attributes for analysis, metrics, and alerting. With the support of the new Dynatrace Pattern Language for character-level matching of desired data in logs, it’s easy to get started quickly with common use cases, like extracting required keywords or parameters. For example, an e-commerce site log about items added to a cart might look like this:
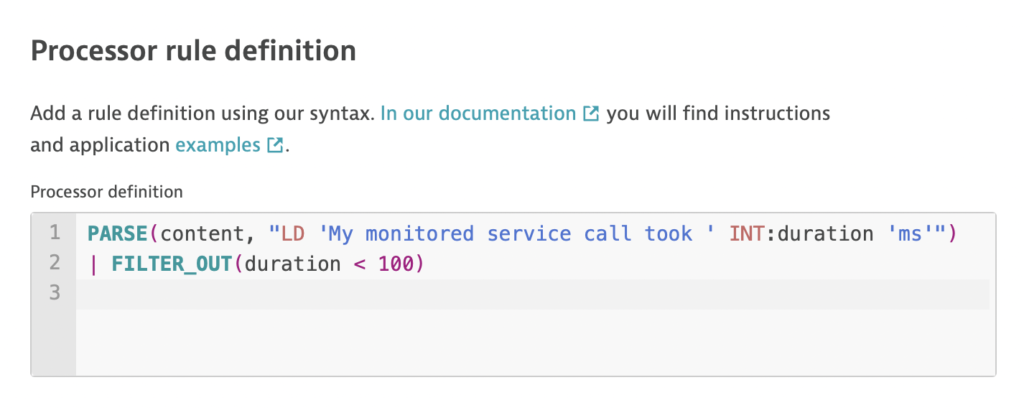
AddItemAsync called with userId=3ed89286-2ad0-43ab-a369-2cee7a0bc622, productId=OLJCESPC7Z, quantity=10.You can extract this business data for reporting using a single PARSE() command. By creating a simple pattern, you can look for any line data that’s followed by two keywords of interest:PARSE(content, "LDATA 'productId=' LDATA:product.id ', quantity=' INT:product.quantity")Now, any ingested logs that match this pattern will have the attributesproduct.idandproduct.quantityextracted automatically. These attribute values can then be used for analysis, metrics, and alerting. - Filtering to reduce noise based on a specific log attribute or conditional statement, for example, filtering out all debug logs. You might only need logs that have values above or below a certain threshold. In this example, FILTER_OUT() is used to drop all logs where the duration of the call is under 100 ms:
PARSE(content, "LD 'My monitored service call took ' INT:duration 'ms'")
| FILTER_OUT(duration < 100)
If a log record holds any attributes that are irrelevant or need to be removed, FIELDS_REMOVE() can be used to filter them out.
- Masking data for compliance. While replacing a log attribute with masking data is easy, the power of the function REPLACE_PATTERN() helps you tackle more precise masking tasks. For example, you can mask the last octet of an IP address, email, or credit card number with a SHA1 hash.
- Conditional transformations enable you to repackage partial or mismatched log data into a more coherent state before saving it to the Dynatrace platform. If an incoming log meets specific criteria, its data can be modified or dropped. New attributes can also be added or transformed.
- Add any attribute to a log record. If the incoming logs from a specific host, service, or other source lack particular attributes, the attributes can be added on ingest.
- Perform basic calculations on log attributes. Simple calculations can be useful for summarizing numerical values on ingest by translating them into log-based metrics. For example, if a log record includes the results of multiple batch jobs, a summary can be calculated with a rule that includes the FIELDS_ADD() command:
FIELDS_ADD(batchjobs.time: (batchjob1.time + batchjob2.time))
The new attribute batchjobs.time can then be converted into a metric for monitoring.
Built-in rules jumpstart your log workflows
The six new commands and tens of functions for log processing, in combination with the power of Dynatrace Pattern Language, enable you to finally unlock the full value of the data locked in your log files.
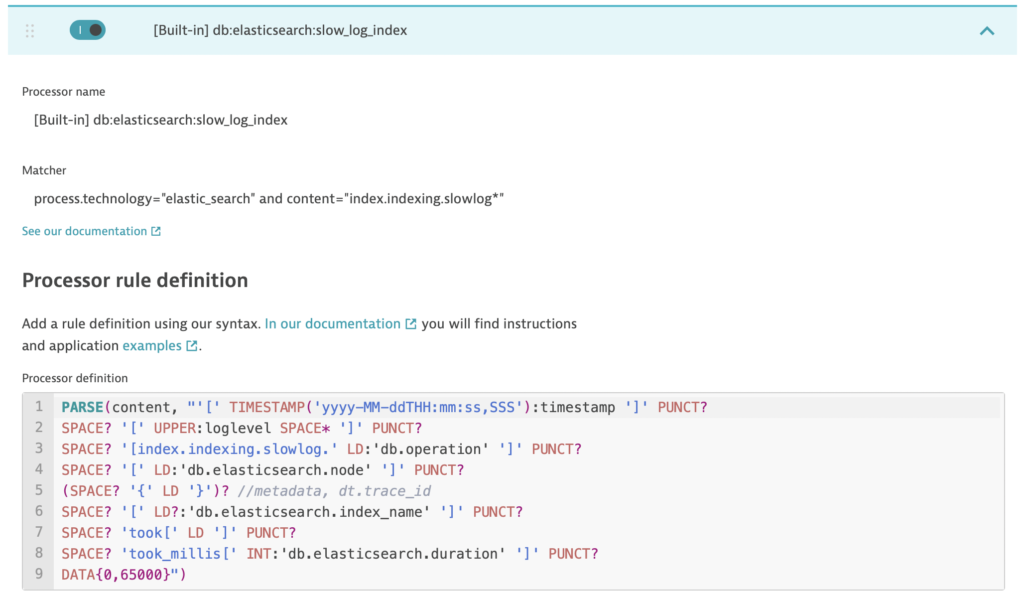
Taking full advantage of these new capabilities might seem like a big effort—it’s not. Dynatrace now offers built-in processing rules to support you in unlocking the full power of Dynatrace log processing.
These built-in rules enrich your logs with distributed traces and links to Real User Monitoring insights. They also cover most common technologies, like NGINX, HAProxy, Elasticsearch, and Cassandra. Logs from these technologies are parsed out of the box for straightforward analysis. At any time, you can inspect these built-in rules or switch them on and off.
Get started now
Early users have already shared how much more value they get out of their logs with processing. You can also start taking full advantage of the insights locked in your log data:
- Log processing is available with Dynatrace version 1.245.
- Creating and using log processing rules doesn’t incur additional costs and is available for Dynatrace SaaS and Managed customers.
- See Dynatrace Documentation for support and to browse the numerous examples.
We look forward to seeing how you put log processing to work and reviewing your feedback in the Dynatrace Community.


Looking for answers?
Start a new discussion or ask for help in our Q&A forum.
Go to forum