
ARM (Advanced RISC Machine) architecture is finally mature enough to offer enterprise customers its promised energy efficiency and powerful performance boost. Implementing the Dynatrace® observability platform with metrics, traces, and logs gives you full visibility into your ARM architecture environment. It unlocks AI-powered problem detection with root cause identification and log-based analytics. Leverage the Dynatrace “secret sauce" by installing OneAgent® on ARM-based hosts to enable automatic log discovery and ingest logs to Grail™ data lakehouse at a massive scale.
Without observability, the benefits of ARM are lost
Over the last decade and a half, a new wave of computer architecture has overtaken the world. ARM architecture, based on a processor type optimized for cloud and hyperscale computing, has become the most prevalent on the planet, with billions of ARM devices currently in use. This growth was spurred by mobile ecosystems with Android and iOS operating systems, where ARM has a unique advantage in energy efficiency while offering high performance.
While ARM processors have been humming in consumers’ pockets for over a decade, enterprise IT adoption has been slower. Legacy data center infrastructure and software support have kept all the benefits of ARM at, well… arm’s length. Still, we at Dynatrace speak to customers who recognize this value and want to implement it.
Energy efficiency and carbon footprint outshine x86 architectures
The first clear benefit of ARM in the enterprise IT landscape is energy efficiency. This is a crucial factor for all data centers, cloud or managed, where power consumption and cooling costs are reflected in the total cost of ownership. Traditional x86 architecture needs more power, so switching to ARM can offer a clear advantage.
Energy efficiency is coupled with the total enterprise carbon footprint. As organizations look to take ownership of their total ecological footprint and help mitigate climate change, it’s critically important for organizations to measure, monitor, and reduce their IT carbon footprints. Initiatives like the Carbon Impact app can be used to measure the footprint of monitored ARM-based hosts compared to x86 hosts.
Huge performance leaps in recent years
The top priority is often performance, where ARM resources have improved significantly. You would have been unimpressed if you evaluated public cloud vendor ARM-based offerings five or more years ago. But take a look at the latest iterations of, for example, AWS Graviton2, which delivered a 40% price/performance boost, and Graviton3, which had an additional 27% price/performance improvement over Graviton2.
These Improvements and other optimizations show that mature service offerings can rely on ARM architecture. You’re no longer required to use a single offering or choose from a few instance families; Graviton includes general-purpose and accelerated-computing offerings, plus compute-, memory-, and storage-optimized instances.
No observability, no gains
All these factors have made ARM an attractive computing architecture for innovative companies. However, the lack of end-to-end integrated observability with full support for log collection is a clear blocker for many organizations looking to adopt ARM-based services.
Without an observability platform to collect and process signals, and provide AI-powered answers for problem detection, root cause identification, and impact analysis, the migration to ARM remains only a roadmap item for many AIOps teams.
Even if some part of your codebase can be instrumented to collect observability data, having all three signal types (metrics, traces, and logs) is crucial. Without collecting logs from the observed platform in a scalable AI-powered data lakehouse like Grail, it’s more of a challenge to identify the root cause of problems and provide details for troubleshooting or security incidents.
Having no access to logs or relying on a siloed approach to logging poses a risk of blind spots in your IT landscape, prolonged outages, and an increase in Mean Time To Identify (MTTI) for incidents, all of which can nullify the benefits of ARM.
Hassle-free ARM deployment with automated log collection
With automated log observability, the Dynatrace platform enables your AIOps team to reap the full benefits of ARM architecture. Dynatrace OneAgent can automatically detect common logs for ARM-based hosts and ingest them on a massive scale out of the box.
As soon as you install just a single OneAgent on a host, for example, an ARM64 (AArch64) based Linux host, the OneAgent scans and autodiscovers logs every 60 seconds.
After installation, you can control OneAgent behavior using a powerful central configuration mechanism in your Dynatrace environment. You can tune the granularity of OneAgent filtering for each host to meet your requirements for discovery and ingestion, share configuration details with other hosts in the same host group, or apply global settings for your whole environment.
As OneAgent collects logs from your ARM-based host, it automatically ties the discovered data to your environment topology. In this way, log data is always associated with the host, service, or other entity that generated it.
AI-powered problem detection can then connect the log data, which often contains the source of truth, to detected issues in your environment, thereby speeding up troubleshooting and remediation by orders of magnitude compared to manual correlation.
In addition, the integration with auto-baselined metrics and automatic connection between distributed traces and logs puts you in complete control of the software you run on ARM-based architectures.
Immediately see the root cause in ARM host logs
You can enable the full value of Dynatrace with log monitoring on ARM in just a few steps.
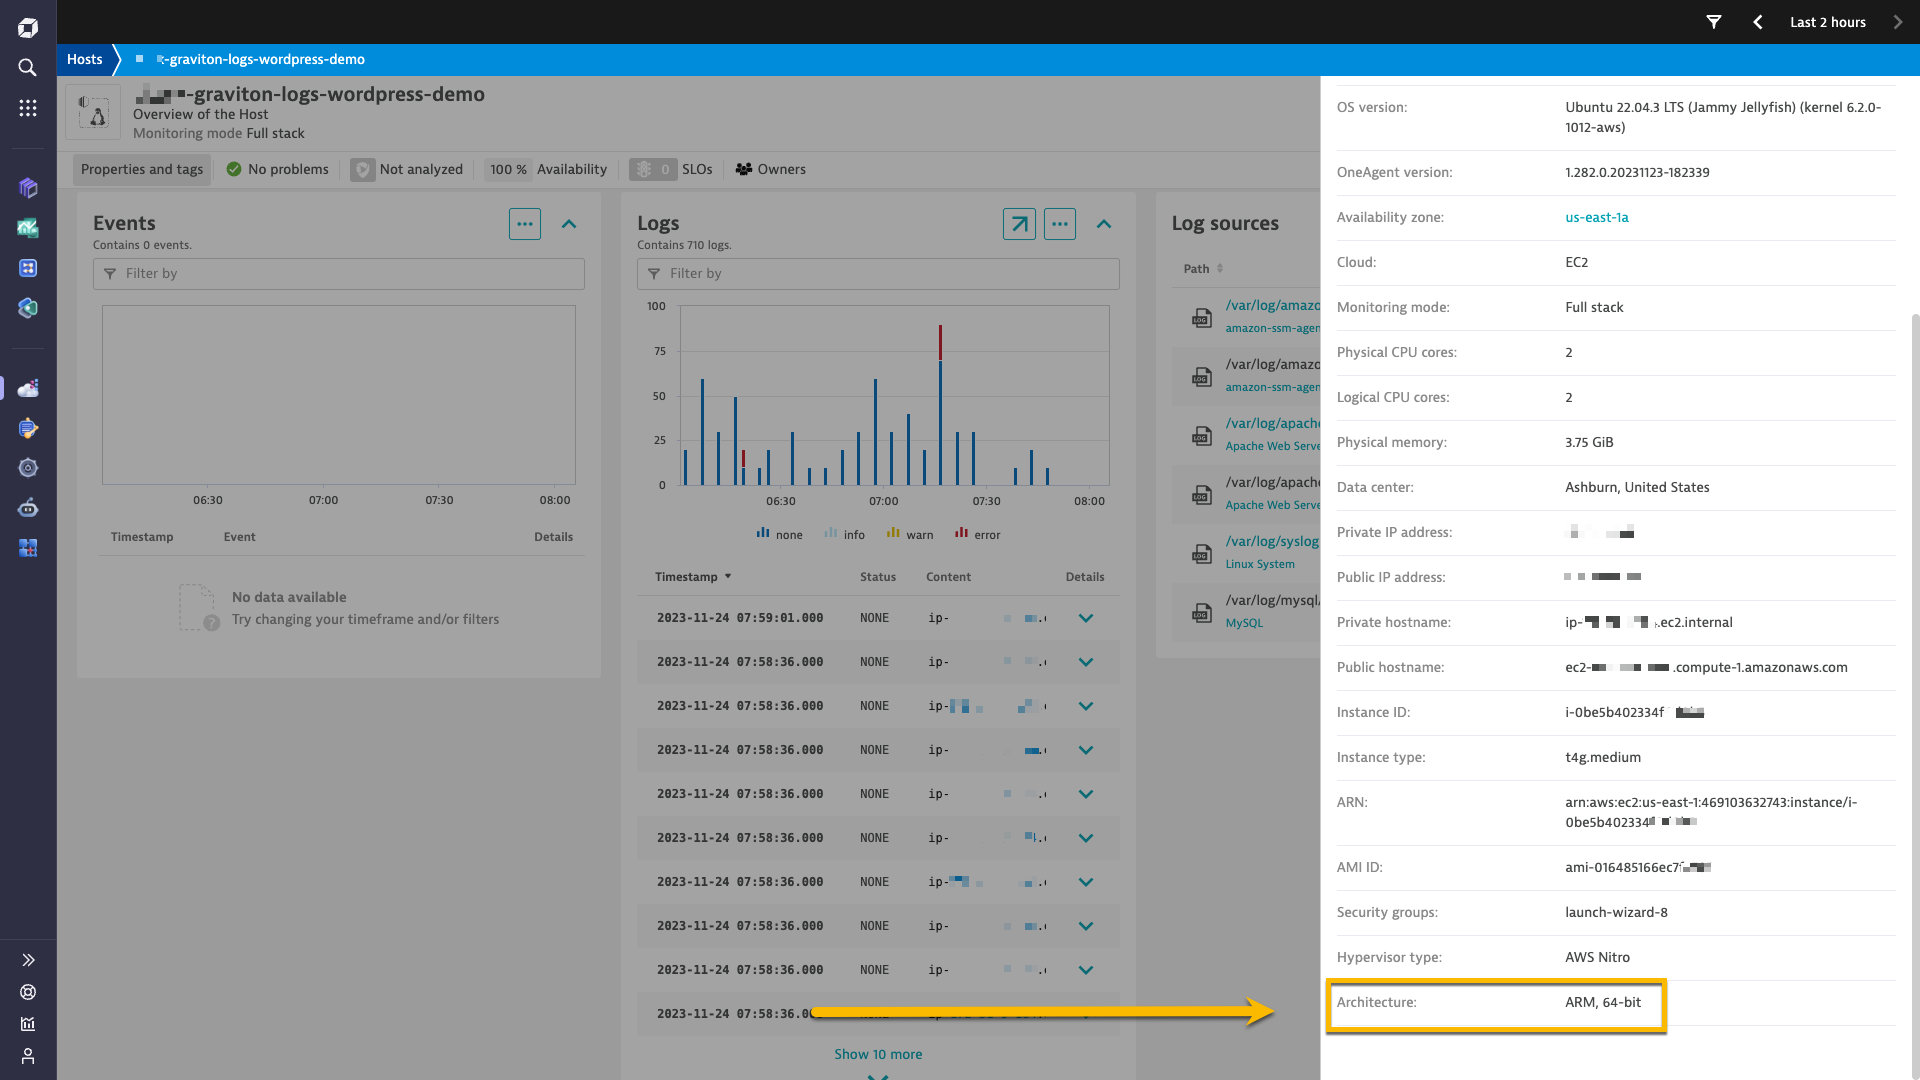
- Install OneAgent version 1.269+ on an ARM host (Go to Apps In the Dynatrace web UI and search for Deploy OneAgent to access the installer). For full details, see OneAgent installation on Linux.
- Following OneAgent installation, you can verify on the host page that the ARM 64-bit instruction set is used.
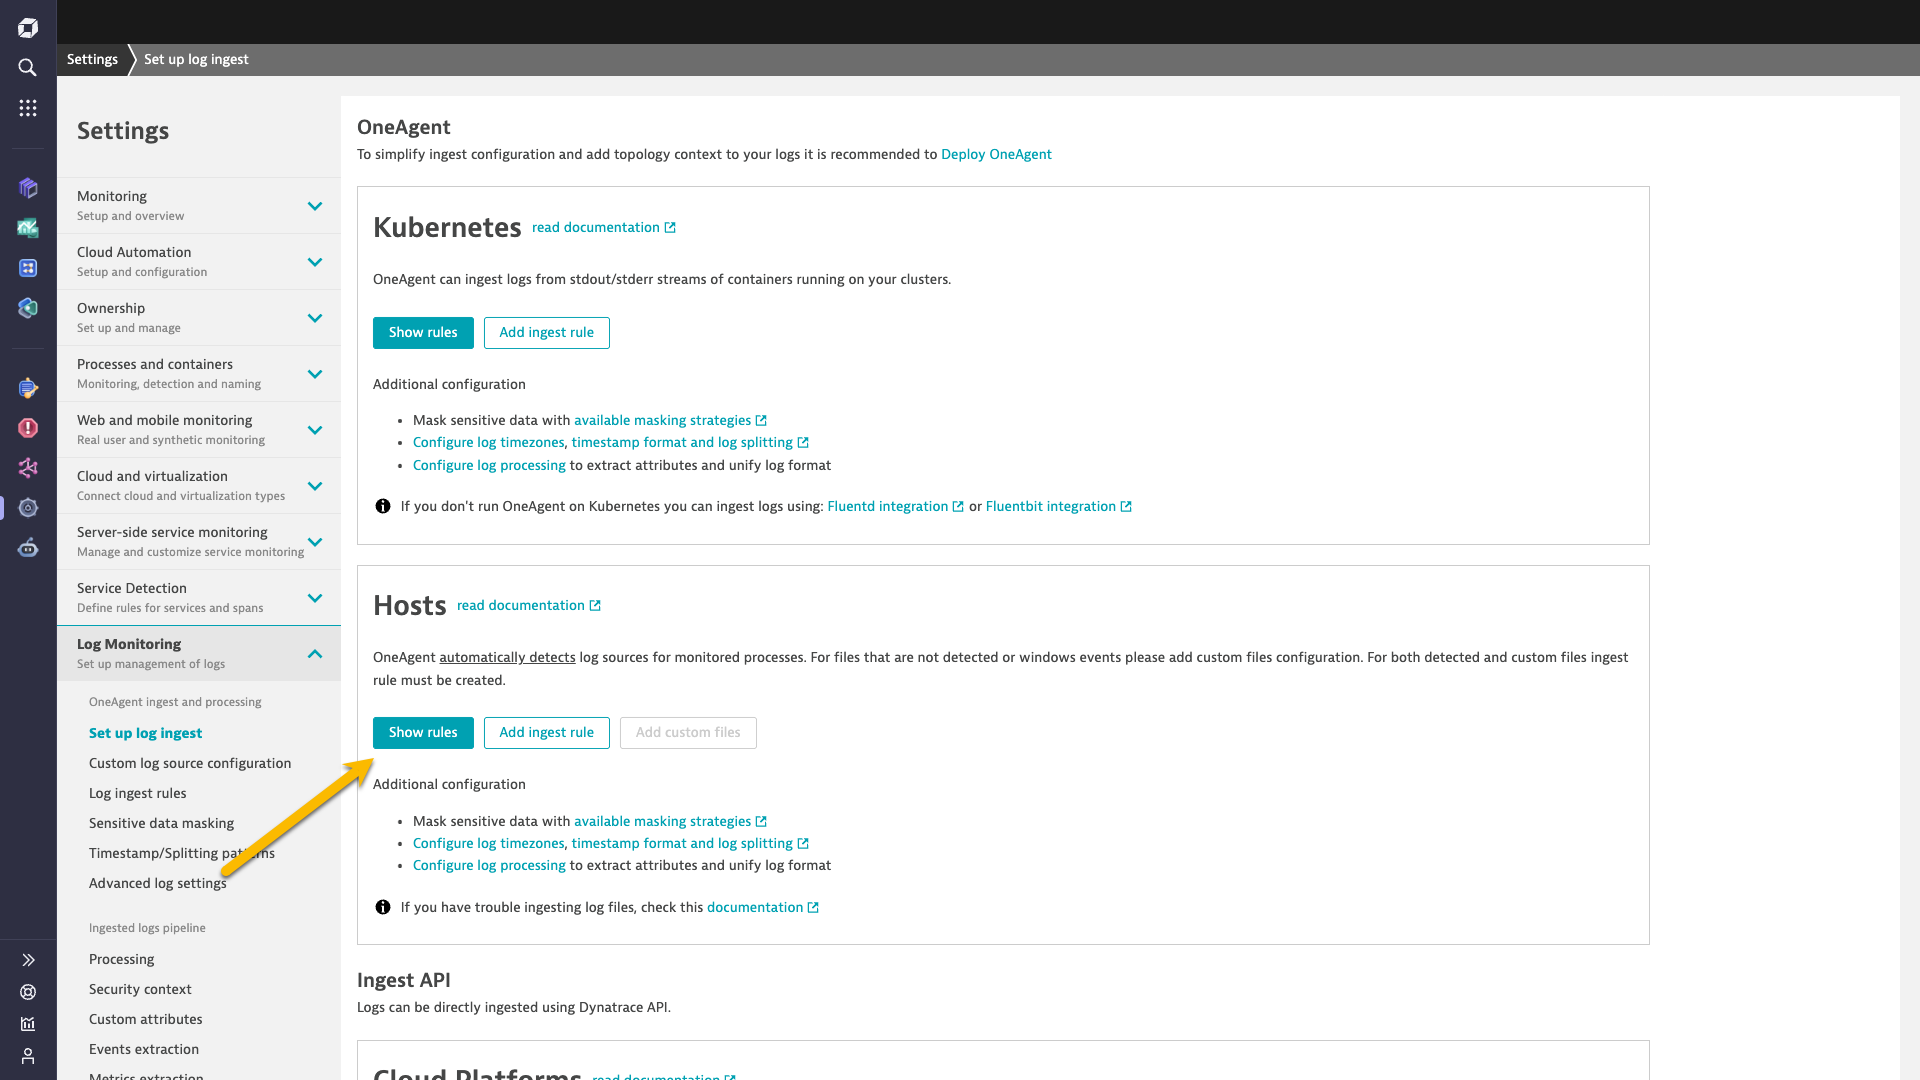
Next, go to Settings > Log monitoring > Set up log ingest and review the log ingestion rules in the Hosts section. For the simplest quickstart, select Show rules.
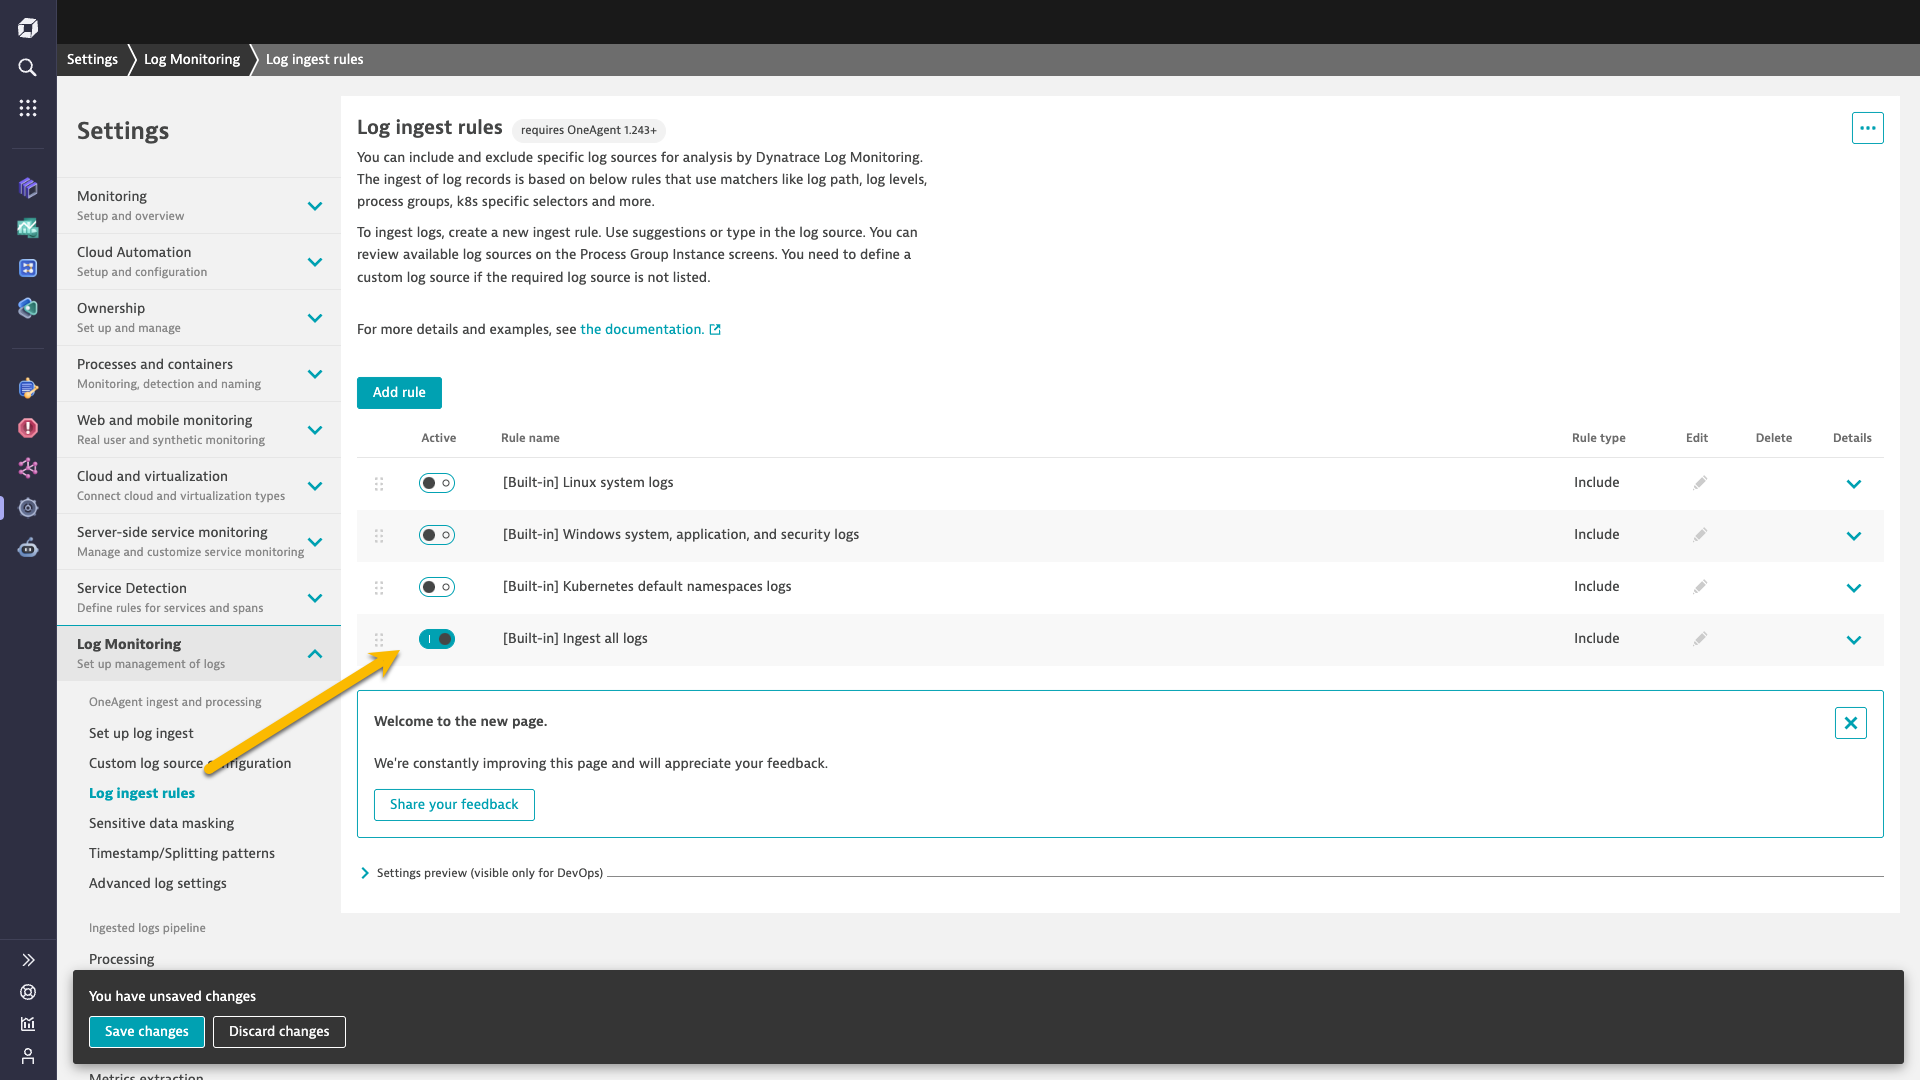
- Turn on the rule [Built-in] Ingest all logs to enable all rules and gain complete visibility into the host.
Now you have the additional value of log data informing your Dynatrace root cause analysis should a problem arise on this host.
In the following example, a synthetic monitor is set up for webpage uptime monitoring. Dynatrace Davis® AI has automatically discovered a problem on the host, and the root cause analysis points to a PHP web service as the source of the problem.
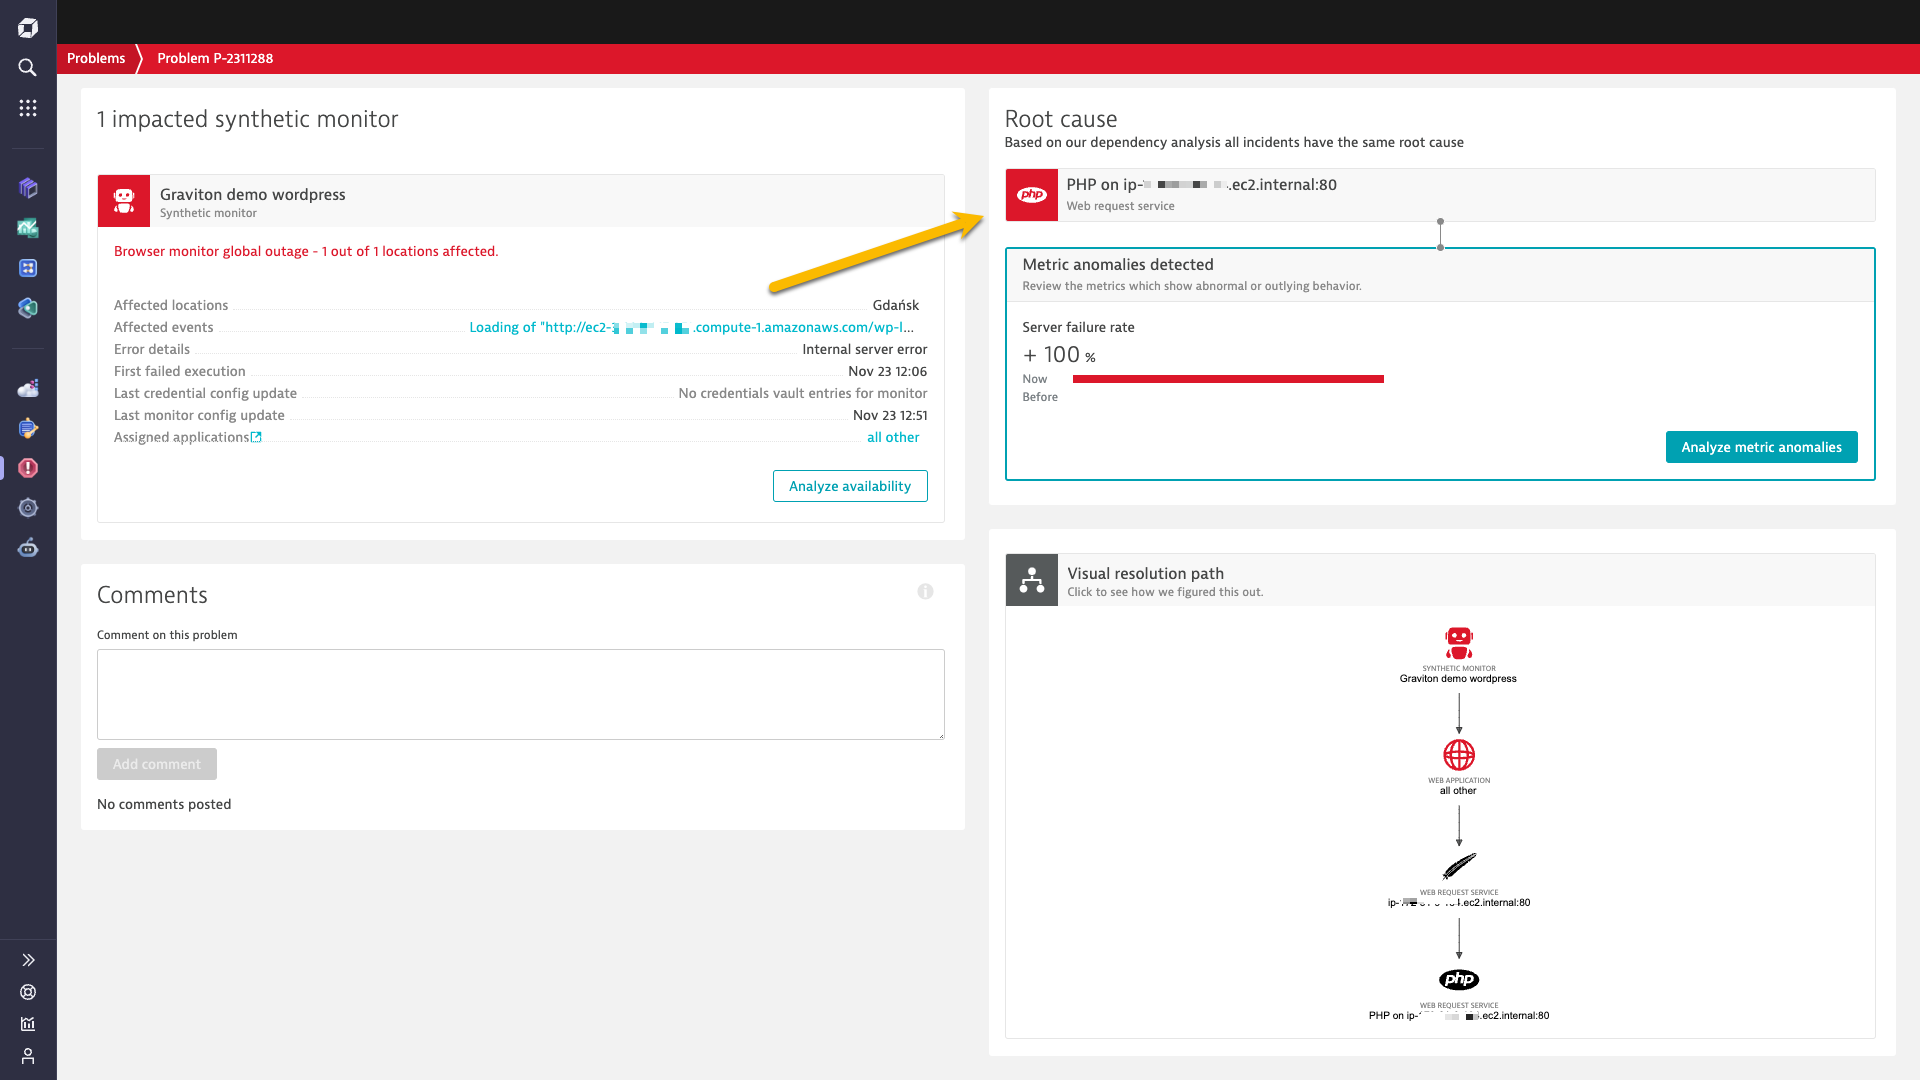
The problem page gives you a direct link to the service causing the disruption, and you can quickly access all related logs.
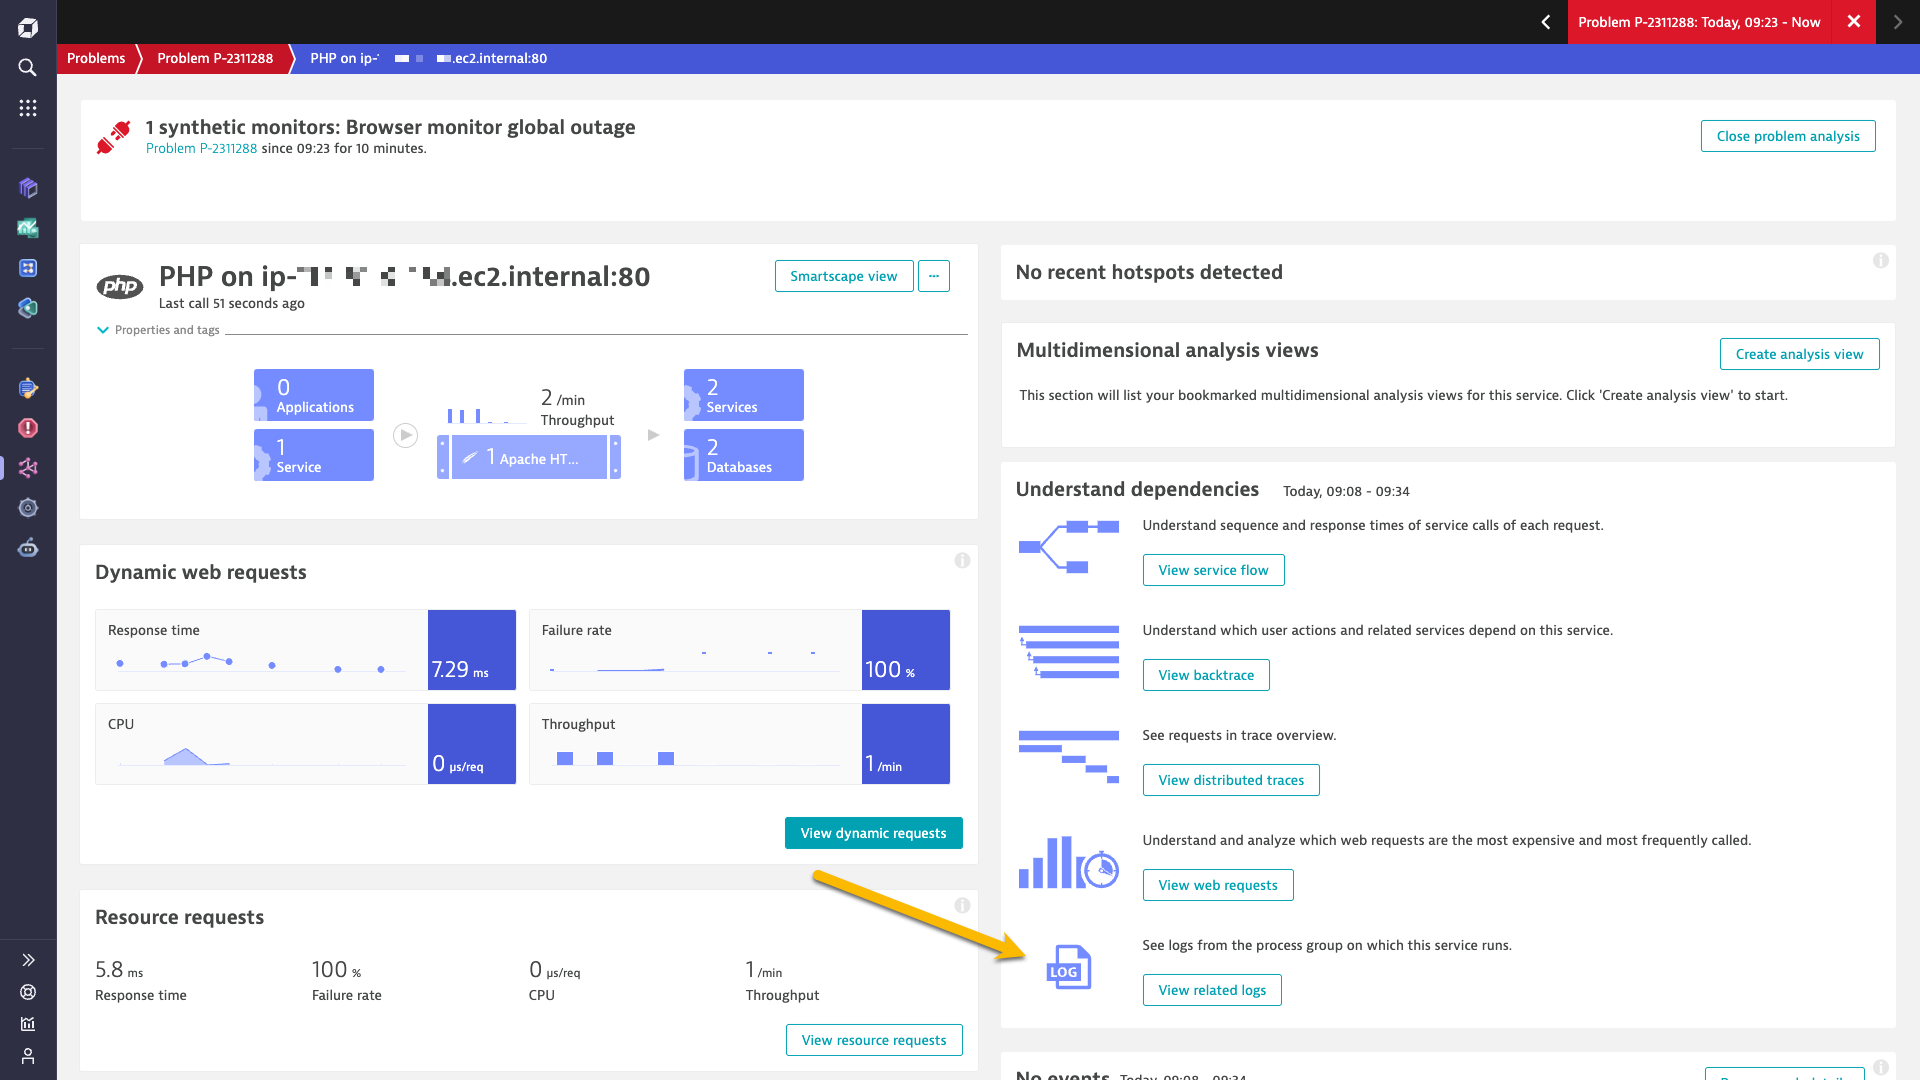
Error logs for the process reveal a PHP syntax error with code-level information that caused the outage.
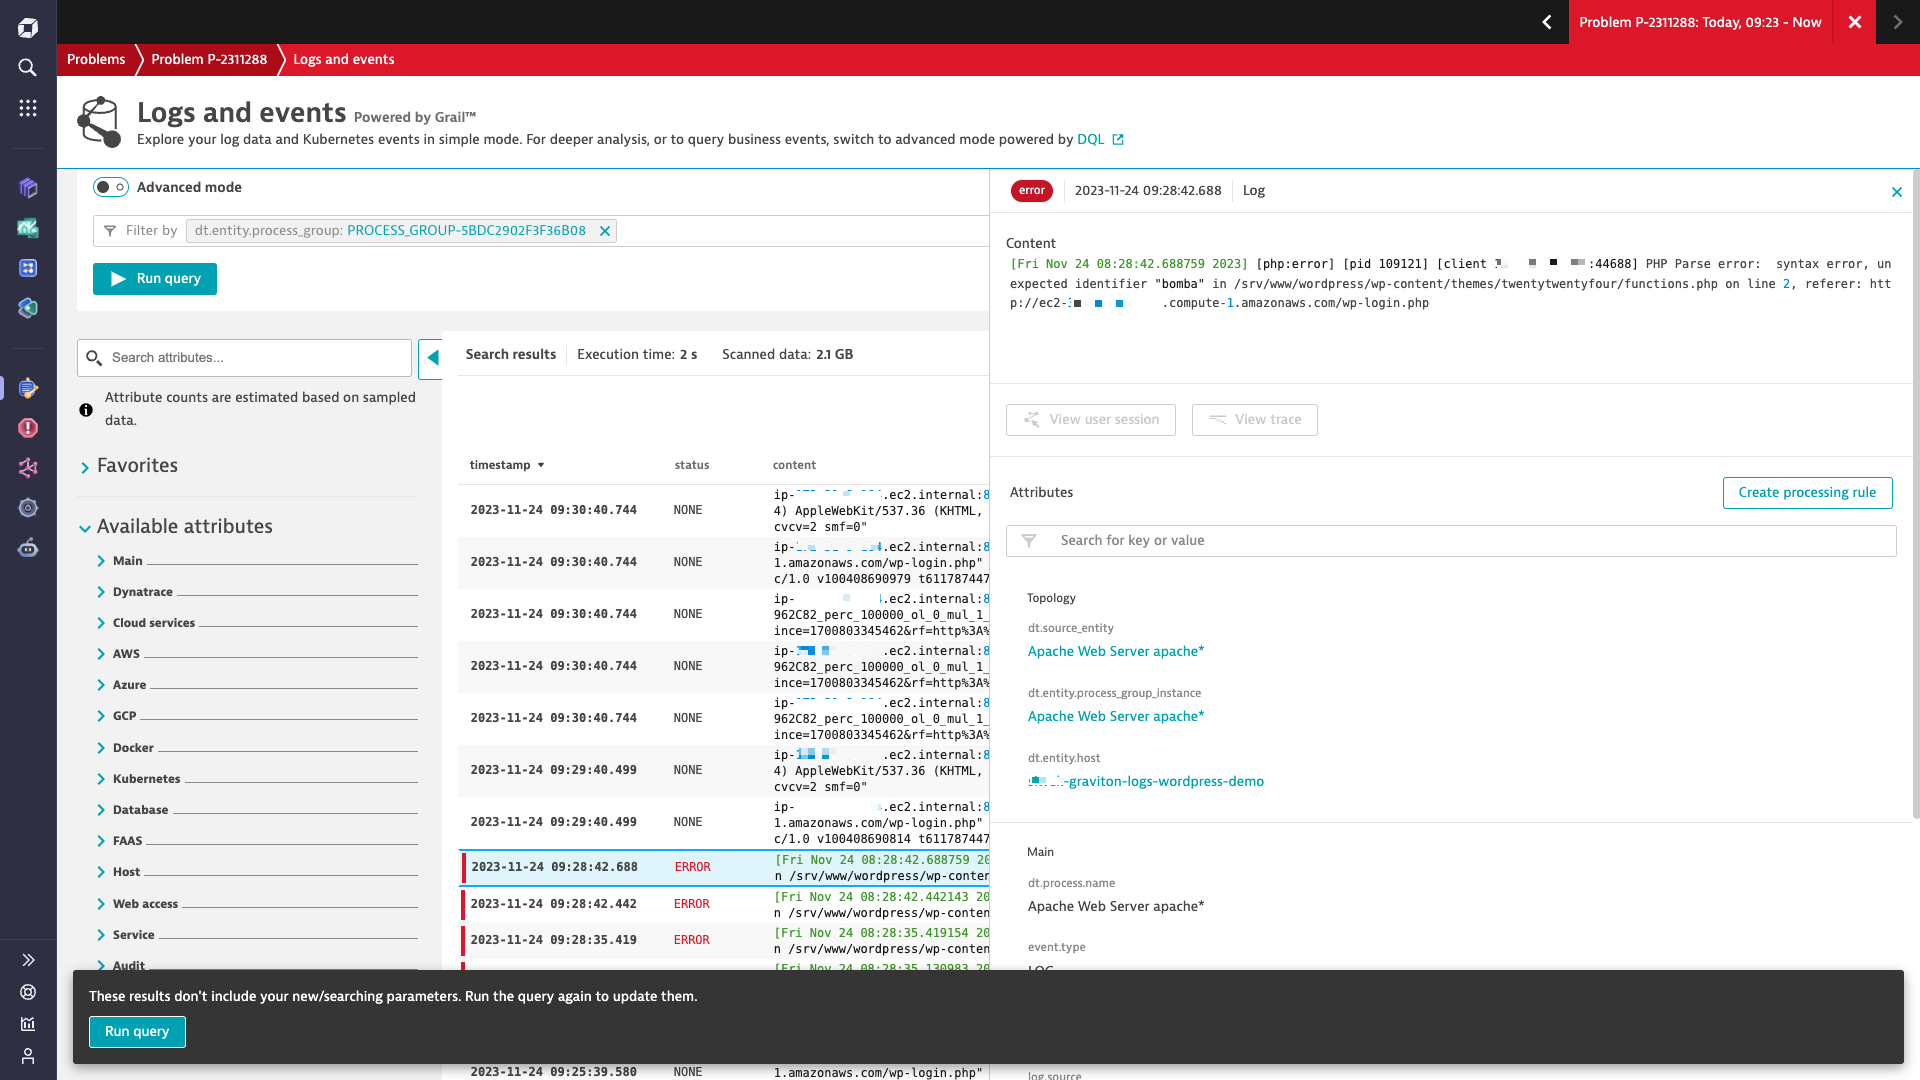
As you can see, with the Dynatrace AI-powered observability platform at your disposal, you can benefit from resource-efficient ARM architectures in your organization without the risk of blindspots or guesswork when you encounter incidents or outages.
Start monitoring ARM and see what’s next
- New to Dynatrace? Open a free trial environment right now and see Dynatrace in action.
- See the OneAgent support matrix for your operating system and deploy OneAgent in your ARM environment today.
- Recently released improvements to the central configuration of all your OneAgents now include:
- Renamed advanced log configuration pages for simpler navigation
- Log filtering based on log level
- Enforced auto-timestamping for logs, in case your log source includes varied log formats that prevent correct timestamp recognition
- Browse the Dynatrace Hub to see how you can bring in logs from different sources and technologies, for example, ingesting Syslog via OpenTelemetry Collector and Oracle log monitoring.
- Share your feedback and expectations with us in the Dynatrace Community
Coming next
We’re working on making Dynatrace log monitoring even easier to use at scale with a focus on areas highlighted by you and other customers:
- Are you ingesting logs across multiple sources with a wildcard (*) ingest rule? Soon, you can enhance log records with custom file names or log path attributes for later analysis in Dynatrace.
- Get automatic log ingest recommendation rules relevant to your environment based on the log sources discovered by OneAgent.
- Tools to troubleshoot the status of your log sources and instructions for resolving issues in cases where a log file is inaccessible.
- See the complete list of log sources on each host page, even if the sources are tied to another process group.


Looking for answers?
Start a new discussion or ask for help in our Q&A forum.
Go to forum