Performance testing tools are becoming more and more critical for accurately predicting system capacity and building quality software. Keep reading and find out our TOP 10 best Performance Testing Tools, including open-source platforms and proprietary testing tools.

Performance testing reveals a system’s behavior under various conditions. While it may excel with 1,000 users, its response to 100,000 may be uncertain. That’s why in the quest for speed, scalability, and stability, we recommend considering specialized tools to simulate high loads when testing how your site or app handles concurrent users.
Top Performance Testing Tools
There exist open-source performance testing tools and also proprietary Performance Testing Tools. Choosing the right and correct performance testing tool can make a world of difference! Not only can it bring you reduced costs, but it also may impact your performance testing activities, enhancing your agile performance testing, continuous delivery, and overall quality.
Open-Source Performance Testing Tools
Open-source performance testing tools, such as JMeter, JMeter DSL, K6, Gatling, and Locust, provide developers and testers with the flexibility to customize, collaborate, and enhance their testing processes, all while benefiting from a community-driven approach and avoiding hefty licensing fees.
Apache JMeter:
Definition: Apache JMeter is an open-source software application that tests and measures the performance and functionality of web services, encompassing both static and dynamic resources.
The Apache Software Foundation created and maintains JMeter, primarily employing it for performance testing. It simulates multiple users and analyzes throughput, latency, and other performance metrics across web applications, databases, and beyond.
Founded: JMeter was first released in 1998.
Purpose: JMeter allows users to create test plans that can simulate various scenarios or user behaviors. It can simulate multiple concurrent users sending requests to a target server and then return real-time results in various reports.
Benefits
- Open Source: Being an open-source tool, JMeter is freely available for download and can be modified to suit specific requirements.
- Versatile: It can be used to test performance for a variety of protocols: HTTP, HTTPS, FTP, Database via JDBC, LDAP, and more.
- Scalable: JMeter can simulate multiple users with concurrent threads, creating a heavy load against the tested service.
- Platform Independence: It’s a Java application, meaning it can run on any environment that supports Java.
- Visual Analysis: Provides extensive reporting features to understand test results better.
JMeter DSL
Definition: JMeter DSL (Domain Specific Language) is a library that streamlines the use of the JMeter performance testing tool through coding in a simple way, without the need to learn a new language or incorporate new tools. This way, it expands the number of possible users able to take advantage of JMeter; it allows faster and simpler testing; and it contributes to the development of quality software.
This open-source contribution developed by Abstracta is already used by users from different parts of the world, such as the United States, India, Russia, Ukraine, and China, and it is being downloaded more and more every day.
Founded: The introduction of JMeter DSL occurred in 2020.
Purpose: The primary goal of JMeter DSL is to boost JMeter’s programmability. This enhancement simplifies the creation, execution, and maintenance of performance tests. By doing so, it aligns better with modern software development practices and integrates seamlessly with continuous development and deployment pipelines.
JMeter DSL enables continuous performance testing to be integrated into existing development pipelines more easily, promoting shift left testing. Furthermore, it simplifies the application of engineering and software development skills to the development and maintenance of JMeter performance tests.
Benefits:
- Facilitated Integration: JMeter DSL enables a smoother integration of performance testing into existing development pipelines continuously.
- Shift-Left Testing: Promotes early testing in the development lifecycle, helping teams catch and address performance issues sooner.
- Enhanced Programmability: Adds a layer of abstraction over JMeter, allowing for the application of standard software engineering concepts and best practices in creating and maintaining performance tests.
- Expanding on JMeter’s Capabilities: While JMeter is powerful on its own, JMeter DSL extends its functionalities, catering to evolving software development needs. Furthermore, JMeter DSL is compatible with BlazeMeter, Octoperf, Azure Load Testing, and DistributedJMeter, allowing for easy scale-up of the load testing.
- Consistency and Maintainability: Given its code-centric approach, it facilitates uniformity in test development and makes maintenance more straightforward.
Learn more about this tool in this article, dive into how to use it in this post, and discover its creation story right here.
Additionally, we strongly recommend you read the following articles:
– Revolutionizing Open Source Performance Testing Tools in the .NET Ecosystem.
– New Release! Integration between JMeter DSL and Azure Load Testing.
– How to Create Load Tests with JMeter DSL from Selenium Scripts in Performance Testing Services.
k6
Definition: This is a cutting-edge, open-source performance testing tool, used to test the scalability, reliability, and performance of software systems, most commonly web services. Unlike GUI-based testing tools, k6 emphasizes scriptability, automation, and integrations into development workflows.
In the industry, there has been a need for a load testing tool that is built for teams that everyone is able to use. The k6 team achieved this, democratizing load testing by building an application written in Go while the scripting is done using JavaScript.
Founded: k6 was initially released in 2017 by Load Impact.
Purpose: k6 lets developers and testers script intricate scenarios in JavaScript, simulating traffic to a target system. They use this to gauge how systems respond under various conditions, ranging from normal to high-load situations.
Benefits:
- Open Source: The community can freely access k6, driving enhancements and solving problems together.
- Scriptable: Developers write tests in JavaScript, which provides flexibility and the option to incorporate modules and external libraries.
- Modern Architecture: k6 suits modern cloud-native architectures, easily integrating with DevOps workflows.
- CLI-Based: k6’s command-line nature enhances its automation potential, making it a prime choice for continuous integration pipelines.
- Extensible: Users can expand k6 and connect it with other platforms, like Grafana and InfluxDB, to delve deeper into visualization and analysis.
Don’t miss our k6’s review!
Gatling
Definition: Gatling stands out as a robust load-testing tool tailored for applications, APIs, and microservices. As highlighted on its website, Gatling plays a pivotal role in anticipating slow response times and system crashes. It slashes the time to market by spotting performance bottlenecks and errors early in the development cycle, ultimately uplifting the user experience.
Purpose: Its main aim is to put systems to the test, challenging their limits and identifying potential weak spots before they become real-world problems.
Benefits:
- Anticipation: Gatling helps developers get ahead of potential issues, predicting slow response times and crashes.
- Speed to Market: By detecting performance issues and errors early on, Gatling accelerates the development process.
- Enhanced User Experience: With optimized performance and fewer errors, end-users enjoy a smoother and more reliable experience.
Keep learning about Gatling in this article!
Locust
Definition: Locust is an open-source software performance testing tool adept at testing and gauging the performance of web services, covering both the static and dynamic aspects. Unlike traditional performance testing tools, Locust emphasizes user-friendly scriptability and integrates smoothly into modern development workflows.
Founded: It made its debut in the tech world in 2013.
Purpose: This tool empowers users to write test scenarios in Python, offering a hands-on approach to simulate thousands of simultaneous users against web applications, databases, or any system, for that matter. This allows for a comprehensive evaluation of how systems perform under diverse conditions.
Benefits:
- Open Source: Anyone can access Locust, promoting a community-driven evolution and collaborative problem-solving.
- Python Scripting: By leveraging the Python language, Locust offers both ease and versatility in crafting test scripts.
- Scalable: With Locust, you can effortlessly ramp up simulations, mimicking a vast number of users interacting with the target system.
- Web UI: Locust comes with an intuitive web-based interface, facilitating real-time insights and interactive test control.
- Flexible & Lightweight: Its lightweight nature and inherent flexibility mean you can run tests locally or scale them up in the cloud.
Don’t miss this article! Performance testing of a Socket.IO Application.
Proprietary Performance Testing Tools
While open-source tools are valuable, proprietary performance testing tools like LoadRunner and NeoLoad offer robust features and dedicated support that can be indispensable in certain scenarios.
LoadRunner
Definition: LoadRunner stands as a premier performance testing tool developed by Micro Focus, widely recognized for its comprehensive testing solutions ranging from simple applications to the most complex enterprise-level systems. It provides a suite of features for load testing, stress testing, and performance monitoring.
It supports various protocols, making it versatile for testing a wide range of applications, including web, mobile, and enterprise systems. Its advanced scripting capabilities and extensive reporting make it a popular choice for organizations seeking in-depth application performance testing insights.
Founded: Originally developed by Mercury in 1993, LoadRunner was later acquired by HP and subsequently by Micro Focus.
Purpose: LoadRunner empowers businesses to simulate virtual users, reproduce real-world loads, and uncover potential bottlenecks, all to elevate the overall performance of applications.
Benefits:
- Robust Testing: LoadRunner can mimic thousands of users to stress-test applications under varied load conditions.
- In-depth Analysis: It offers detailed insights into end-to-end system performance, helping teams pinpoint issues.
- Integrated Monitoring: With built-in monitors for over 50 application environments, LoadRunner covers a broad spectrum of testing scenarios.
- Extensive Protocol Support: Accommodates a wide range of applications, including legacy systems.
BlazeMeter
Definition: BlazeMeter emerges as a cloud-based performance testing platform built upon the open-source foundation of Apache JMeter. It amplifies JMeter’s capabilities, offering scalability, analytics, and a user-friendly interface.
Founded: BlazeMeter began its journey in 2011.
Purpose: Designed to enhance and simplify performance and load testing for web applications, BlazeMeter provides real-time insights, scalability, and collaborative features for teams of all sizes.
Benefits:
- Cloud-based Flexibility: Test from multiple geographical locations without the need for dedicated infrastructure.
- Collaborative Testing: Teams can collaborate in real-time, refining tests and sharing results.
- Real-time Reporting: Offers visually engaging reports to break down performance metrics.
- Integration Friendly: Connects seamlessly with popular CI/CD tools, enhancing DevOps workflows.
NeoLoad
Definition: NeoLoad by Neotys is a dynamic performance testing solution designed to speed up testing cycles without compromising the accuracy of the results.
It offers a user-friendly interface and scripting in JavaScript, making it accessible to a broad range of users. It emphasizes collaboration within teams, making it easier to share and analyze performance test results.
NeoLoad’s advanced features include load testing, stress testing, and support for various technologies and integrations, making it suitable for complex performance testing scenarios.
Founded: Neotys launched NeoLoad in 2005.
Purpose: NeoLoad addresses the challenges of modern application environments by offering fast, automated performance testing that can adapt to frequent changes.
Benefits:
- Rapid Test Design: Quickly design test scenarios with an intuitive interface.
- Dynamic Infrastructure: Adjusts to match the scale of testing requirements, whether local or cloud-based.
- Advanced Analytics: Visualizes data with customizable dashboards to inform decision-making.
- Continuous Testing: Fits effortlessly into CI/CD pipelines to maintain pace with agile developments.
Azure Load Testing
Definition: Azure Load Testing is a comprehensive, managed load-testing service designed to simulate high-scale traffic for applications, irrespective of their hosting environment. Developers, testers, and QA engineers leverage this service to fine-tune application performance, scalability, and capacity.
With its innate simplicity, Azure Load Testing allows the quick creation of load tests for web applications using just a URL. Additionally, for intricate load-testing scenarios, it offers compatibility with existing Apache JMeter test scripts, a renowned open-source tool for performance and load testing.
Founded: Launched by Microsoft in February 2023.
Purpose: Azure Load Testing aims to assist teams in identifying performance bottlenecks by simulating large-scale traffic to their applications. Its capabilities extend beyond just testing; it also provides a real-time dashboard showcasing both client and server-side metrics during tests.
This allows users to analyze results and pinpoint performance issues efficiently. Azure Load Testing not only supports public applications but also integrates seamlessly with private application endpoints or on-premises hosted apps. An added advantage is its integration into continuous integration and continuous deployment (CI/CD) workflows, promoting automated load testing and early detection of performance degradation.
Benefits:
- Simplified Testing: With Azure Load Testing, users can effortlessly generate load tests for web applications using a mere URL.
- Compatibility with JMeter: For intricate testing needs, Azure Load Testing supports Apache JMeter test scripts, broadening the range of testing scenarios.
- Real-Time Analytics: While the test runs, users have access to a live dashboard that offers insights into client and server metrics, aiding in quick analysis and decision-making.
- Automated Load Testing Integration: Azure Load Testing can be integrated into CI/CD pipelines, allowing automated load tests at significant points in the development lifecycle. This promotes early detection of performance issues.
- Private Endpoint Testing: Beyond public applications, the service extends its testing capabilities to private application endpoints and on-premises hosted apps.
- Detailed Resource Metrics: For applications hosted on Azure, the service gathers in-depth resource metrics, providing insights into performance bottlenecks across Azure application components.
Don’t miss this article! New Release! Integration between JMeter DSL and Azure Load Testing.
OctoPerf
Definition: OctoPerf is a comprehensive load-testing tool rooted in real browser testing, offering insights from a user’s perspective rather than just server metrics.
Based in France, the company is present in more than 32 countries. It is a SaaS and On-Premise performance testing tool. A load simulation tool for performance testing, which provides a web interface that manages to be considered a low code tool for performance.
OctoPerf is based on JMeter, and simplifies the scripting efforts thanks to its codeless scripting studio. It offers many facilities to make the process easier and reduce the time required.
On the other hand, the reporting possibilities offered are excellent. OctoPerf allows customization of the reports that will be generated and integrates various simulation metrics to provide insights into infrastructure behavior. With the same aim, it also integrates with monitoring tools.
Founded: OctoPerf started its mission in 2015.
Purpose: OctoPerf prioritizes user-centric performance metrics, ensuring applications not only function but thrive in real-world conditions.
Benefits:
- User Simulation: Replicates real-world browser interactions, capturing true user experiences.
- Intuitive Design: Its drag-and-drop features expedite test creation without sacrificing depth.
- Actionable Feedback: Offers clear, actionable feedback to drive improvements.
- Scalability: Handles everything from small-scale tests to enterprise-level scenarios with ease.
Did you know that we have formed a strategic alliance with OctoPerf? Therefore, now we are able to provide our customers with a wider range of performance testing tooling options as a result.
These proprietary tools come with licensing costs but can be invaluable for organizations that require advanced performance testing capabilities and dedicated support. When choosing between open-source and proprietary tools, it’s essential to consider your specific project requirements, budget, and the level of support needed to achieve your performance testing goals.
Which factors should you consider while selecting a Performance Testing Tool?
When venturing into the intricate world of performance testing, aligning your chosen tool’s capabilities with your project’s specific demands is paramount.
If you’re focusing on web applications, specific load-testing tools might be more apt, especially when differentiating between load testing and functional testing. Now, considering the growing importance of automation, an automated performance testing tool can be a game-changer. It offers the flexibility to easily create load tests and interpret test results with precision.
Budget always plays a pivotal role, but remember, the best performance testing tool doesn’t solely hinge on price. While some tools are adept at simulating numerous concurrent users and pinpointing performance bottlenecks, others might be tailored for scalability testing or volume testing.
Essential features like compatibility with multiple operating systems, adaptability in test scenarios, and diverse protocol support should be on your checklist.
As your projects evolve, your tool should too. The dynamic world of software might lead you to explore distributed load testing or confront unexpected performance issues down the line.
Your tools should adeptly manage test scripts for web applications. In fact, the rise of scriptless load test creation testing signifies a shift towards more intuitive testing approaches, allowing teams to devise load tests without the intricate scripting process, saving time and resources.
In conclusion, while the quest for top performance testing tools can be daunting, a clear grasp of your requirements combined with a deep understanding of performance tests streamlines the selection process, ensuring optimal outcomes.
Step-by-Step Guide to Selecting Your Performance Testing Tools
1. Define Your Requirements: Start by listing out your specific performance testing needs. Are you primarily focused on load testing, stress testing, or perhaps spike testing? Do you also need the tool to support functional testing?
2. Research and Shortlist: Based on your requirements, research the available tools. Look for lists of top performance testing tools and best performance testing tools online, and shortlist those that align with your needs. We hope that the list of tools we have prepared for you will be useful at this point.
3. Test Script Flexibility: Check if the tools offer scriptless load test creation capabilities. This is especially helpful for teams that might not have scripting expertise but still want to create sophisticated performance tests.
4. Evaluate Supported Environments: Ensure the tool supports the specific environments you’re testing, such as different operating systems or web applications.
5. Scalability and Concurrent Users: Assess how the tool manages distributed load testing and the number of concurrent users it can simulate. This aspect is crucial if you’re anticipating high user loads.
6. Identify Performance Bottlenecks: Opt for a tool such as Datadog that helps in pinpointing performance bottlenecks effectively, ensuring your application’s optimal performance.
7. Review the Pricing Model: If you choose a proprietary tool, make sure that the tool’s pricing fits within your budget. Consider not just the initial cost but also any ongoing fees or costs associated with scaling.
8. Test the Tool: Most tools offer demo versions. Utilize this opportunity to run real-world test scenarios, evaluating user-friendliness, detailed reporting, and other essential features.
9. Community and Support: A strong community and good support can be invaluable. Determine if the tool has an active user forum, a wealth of online resources, and responsive customer support.
10. Integration Capabilities: Verify that the tool can integrate seamlessly with any other software or platforms you might be using, such as continuous integration systems or monitoring solutions.
Looking for a Quality Partner for Performance Testing?
Embrace agility and cost-effectiveness through our Performance Testing Services, hand in hand with our performance test engineers.
We are quality partners! Learn more about our solutions here and understand why we have received such praise. Contact us to discuss how we can help you grow your business.

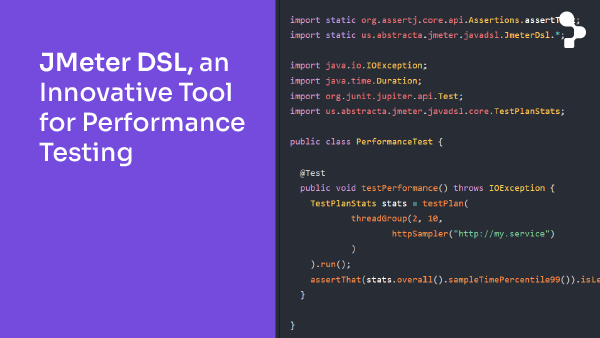
JMeter DSL, an Innovative Tool for Performance Testing
What is JMeter DSL, what improvements does it bring with respect to JMeter, what are the new functionalities it provides? This open source contribution developed by Abstracta is already used by users from different parts of the world, such as the United States, India, Russia,…

Mastering Salesforce Performance Testing
Behind every optimized Salesforce application, there’s a meticulous performance testing strategy. Embark with us on a journey to understand why and how Salesforce performance testing stands as a pivotal element for businesses today. In today’s digital-first world, where seamless user experiences define brand reputations, ensuring…
