
Although Northwestern Mutual experienced a 70% productivity increase by adopting Dynatrace, one blind spot remained. OpenTelemetry observability plus Dynatrace gave Northwestern Mutual the key to unlocking enterprise-wide observability for answers at scale.
If a microservice falls in the forest and all your monitoring solutions report it differently, can operators accurately trace what happened and automate a response? OpenTelemetry observability provides the answer to this philosophical conundrum.
Different monitoring point solutions, such as Jaeger, Zipkin, Logstash, Fluentd, and StatsD, each have their own way of observing and recording such an event. Like the tree in the forest, the microservice falling definitely made a sound. But with different takes on it from various monitoring tools, there’s no agreement on exactly what caused it to fall. Or what its falling could mean for all the other services that interact with it. Some monitoring tools may not have detected it at all.
OpenTelemetry provides a standard way to instrument and collect telemetry data so you can get normalized data from different monitoring solutions. This uniform approach to collecting data helps you make sense of these different viewpoints so you can tell just what happened and what to do about it.
But, as Justin Scherer, senior software engineer from Northwestern Mutual found, OpenTelemetry by itself is not a panacea.
What is OpenTelemetry?
OpenTelemetry is an open source framework that provides agents, APIs, and SDKs that automatically instrument, generate, and gather telemetry data. Based on the W3C open standard Trace Context, OpenTelemetry standardizes telemetry data from multiple sources, so organizations have the capacity to deeply analyze software behavior and performance.
“For the first time, we have a consistent API to gather this data across many different languages and a consistent protocol for all these signals,” said Michael Kopp, application observability product lead at Dynatrace, during a recent talk at Perform 2023. “It’s so big that all three major cloud providers are building OpenTelemetry into their own platforms. It’s also being built into Kubernetes.”
How OpenTelemetry works
Observability data is the stock-in-trade of OpenTelemetry: Logs, metrics, and traces.
Using the Trace Context standard, OpenTelemetry provides agreement about the fields and data types that determine the start and end of each span of a trace among endpoints, middleware, and the cloud services that connect them.
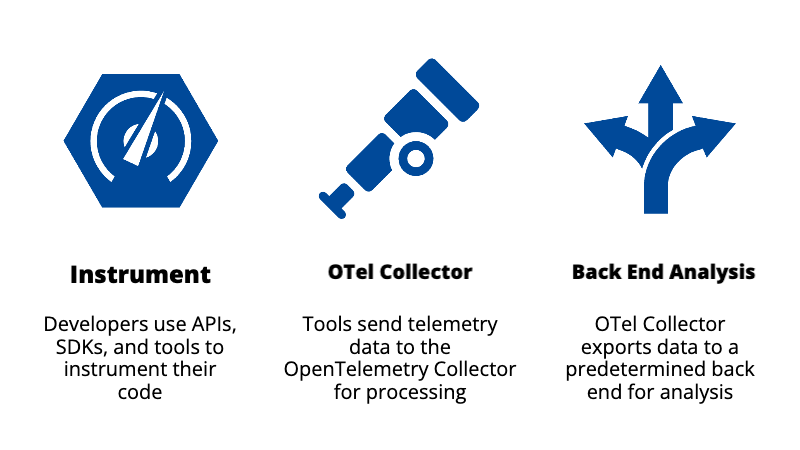
OpenTelemetry works by providing developers with APIs, SDKs, and tools to instrument their code and collect telemetry data such as logs, metrics, and traces. Once instrumented, the tools send the telemetry data to the OpenTelemetry Collector. The collector processes the data and exports it to a predetermined monitoring, tracing, or logging backend, such as Dynatrace, for analysis.
Overall, the OpenTelemetry framework is highly customizable and extensible. It also provides tools and integrations with popular open source projects, including Kubernetes, Apache Kafka, Jaeger, and Prometheus, among others.
Sweet as all this consistency is, however, OpenTelemetry comes with some challenges.
Challenges of adopting OpenTelemetry
The first challenge is that OpenTelemetry only gathers and processes data—it has no backend, no storage, and no analytics. This means that before OpenTelemetry can work its observability magic, you first have to determine your observability goals. Once you know what you want to track, you set up OpenTelemetry using a bespoke set of tools or a commercial solution like Dynatrace. This involves configuring the OpenTelemetry exporters, agents, and collectors to instrument the data from your various services and infrastructure in preparation for processing by your chosen backend.
For some services, this is pretty straightforward. But for others, such as custom applications, this setup can get complex. Especially as you decide what to measure and how to define spans, the many individual processes that make up an end-to-end transaction.
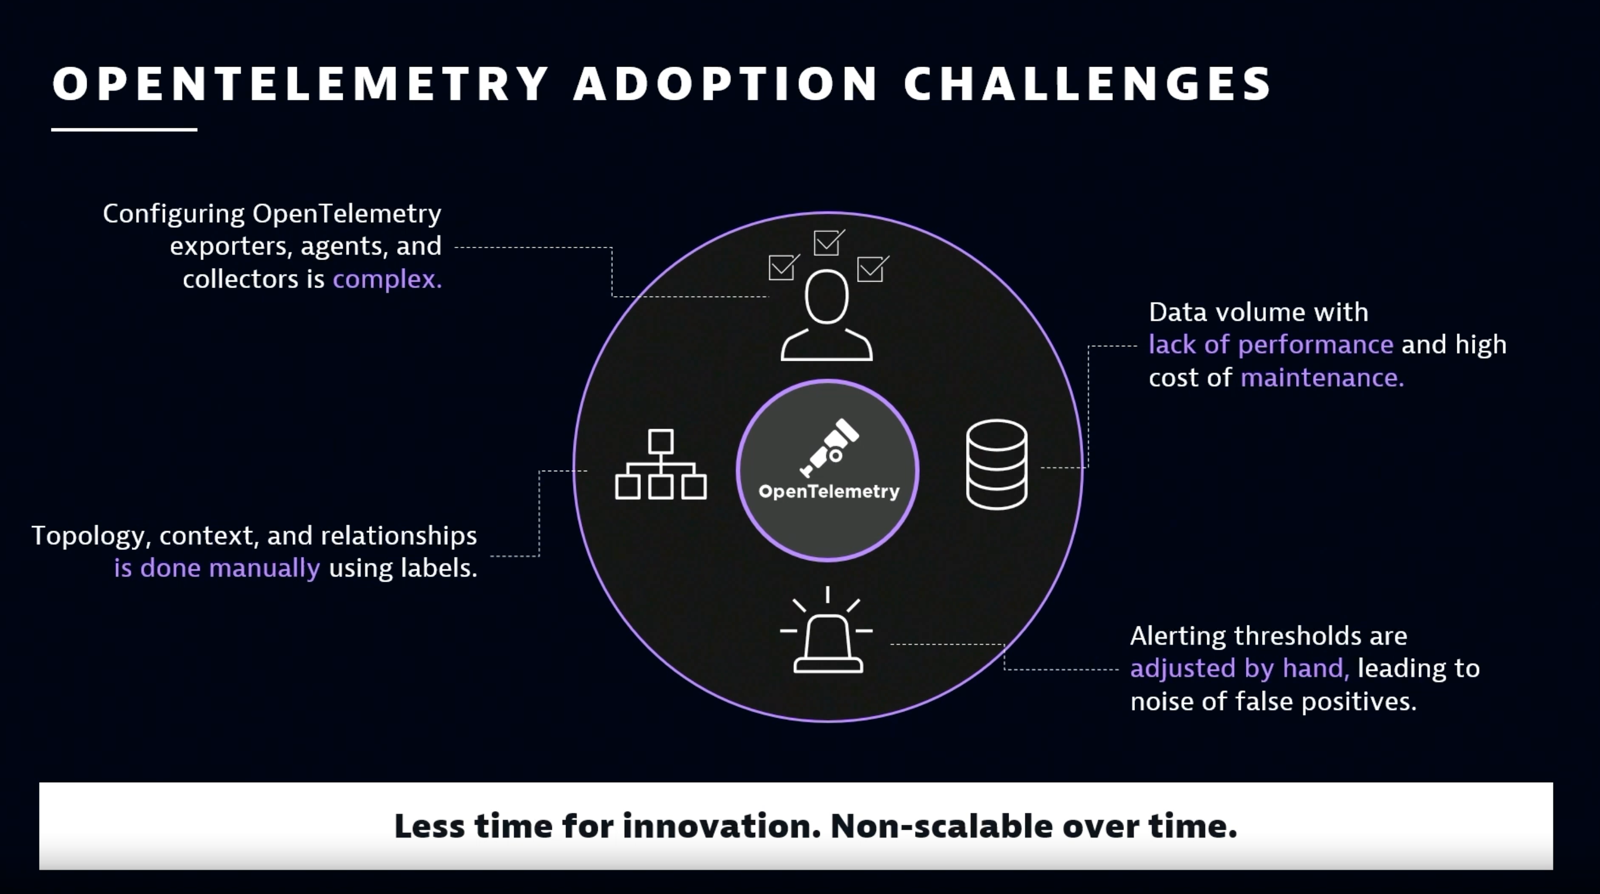
Moreover, any context you want to capture, such as relationships between entities, you have to define manually using labels. Likewise, you have to adjust alerting thresholds by hand to avoid unnecessary alert storms and false positives.
Finally, the enriched observability data increases the overall volume of the data, which can affect application performance. “In most cases, the backend customers use for OpenTelemetry is either not capable of storing more than 1-5% of their traces, or it is not cost efficient to do so,” Kopp says. And maintaining the instrumentation configurations can get cumbersome as your software and toolsets evolve.
Rising complexity, lack of context, and increased volume require a unified platform approach to analyzing OpenTelemetry observability data
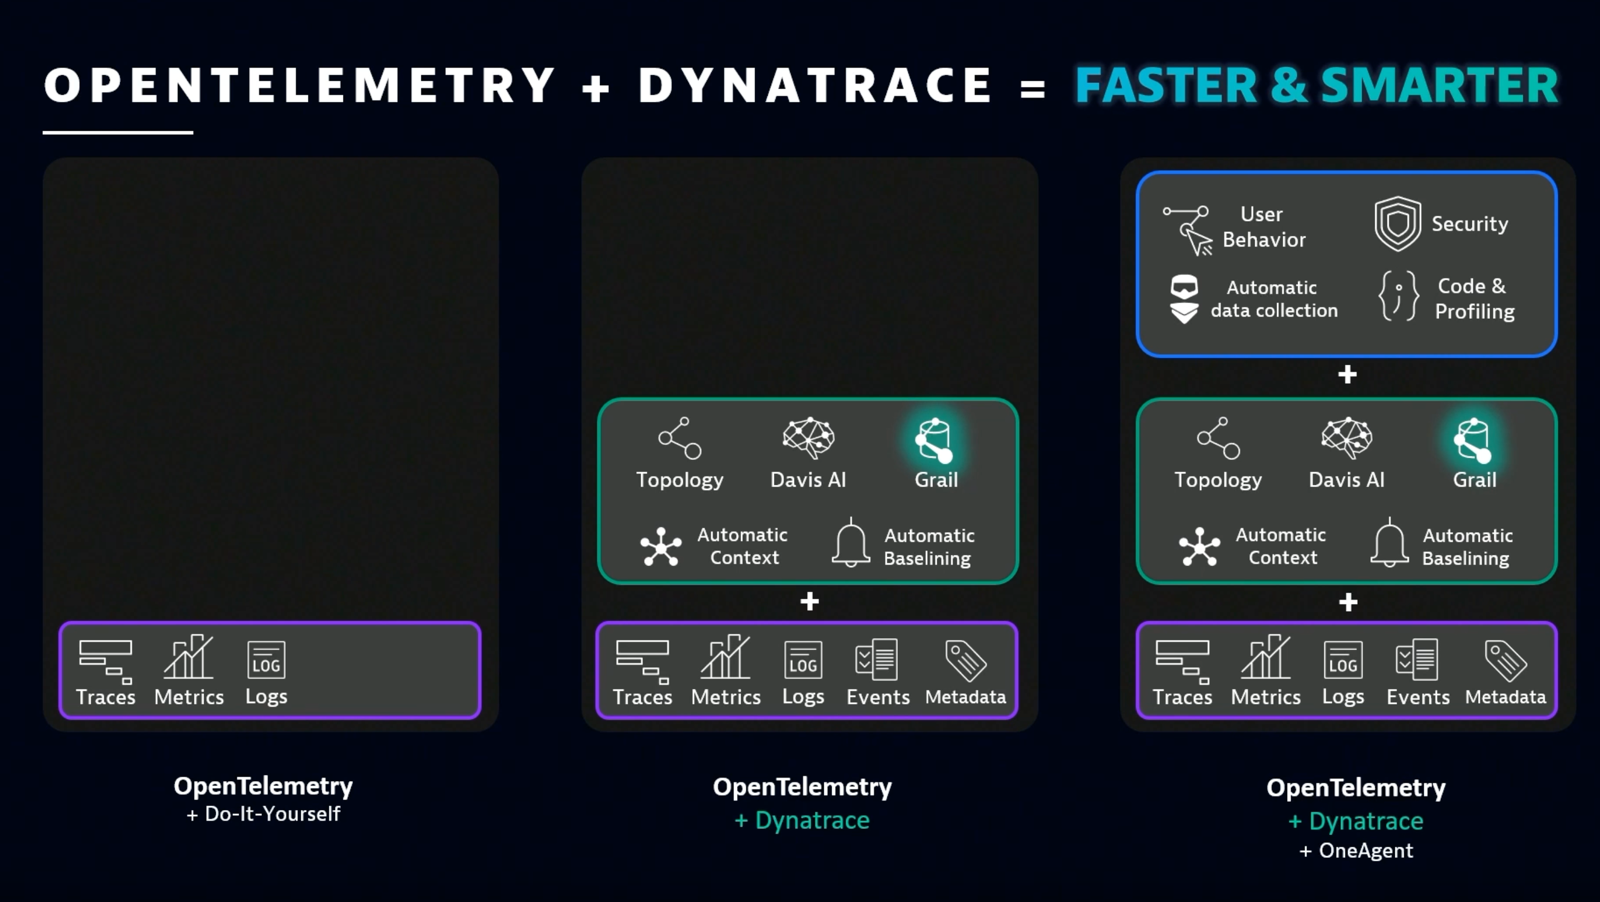
On the other hand, Kopp says, “Dynatrace can consume up to 100% of trace volume, automatically adapting the sampling rate every minute to fit a predefined ingest volume without scaling issues and at very affordable rates. This is something that DIY solutions don’t do.”
The Dynatrace platform solves these problems with Smartscape topology mapping, Davis AI, and the Grail data lakehouse. Using Dynatrace OneAgent adds automatic data collection and enables user behavior analytics and application security use cases, as well as code-level analytics and profiling. In combination, Dynatrace extends OpenTelemetry observability, and OpenTelemetry extends Dynatrace observability.
Dialing in the detail with OpenTelemetry observability and Dynatrace
Scherer puts these capabilities into perspective from his experience with Northwestern Mutual (NM). When his team adopted Dynatrace in 2022, “there was immediately a 70% increase in productivity. We were able to collect every single trace and metric, and we were able to find problems that we honestly didn’t know we had.”
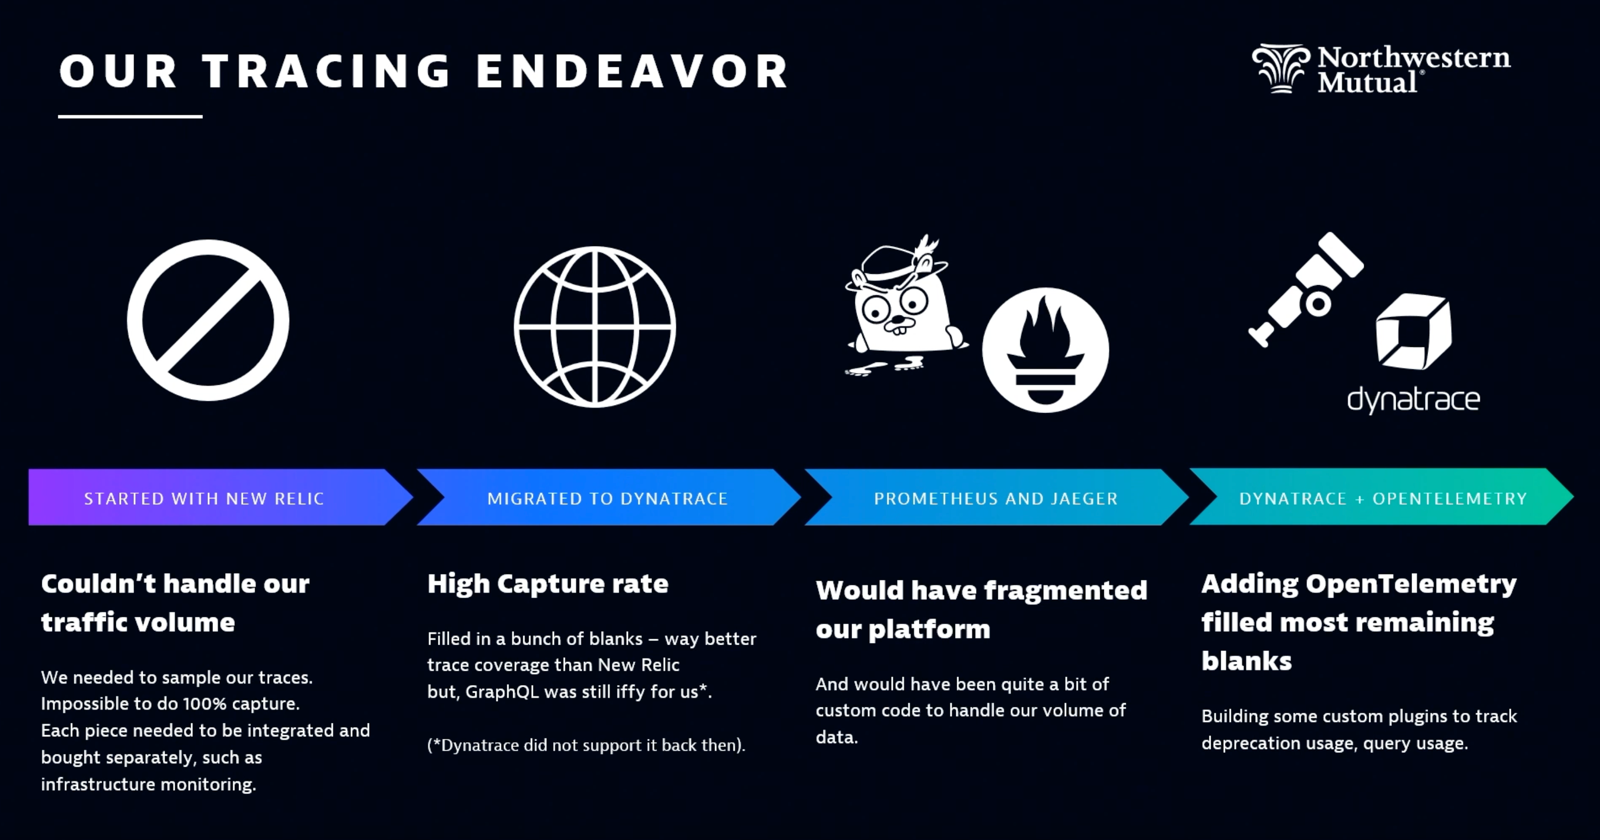
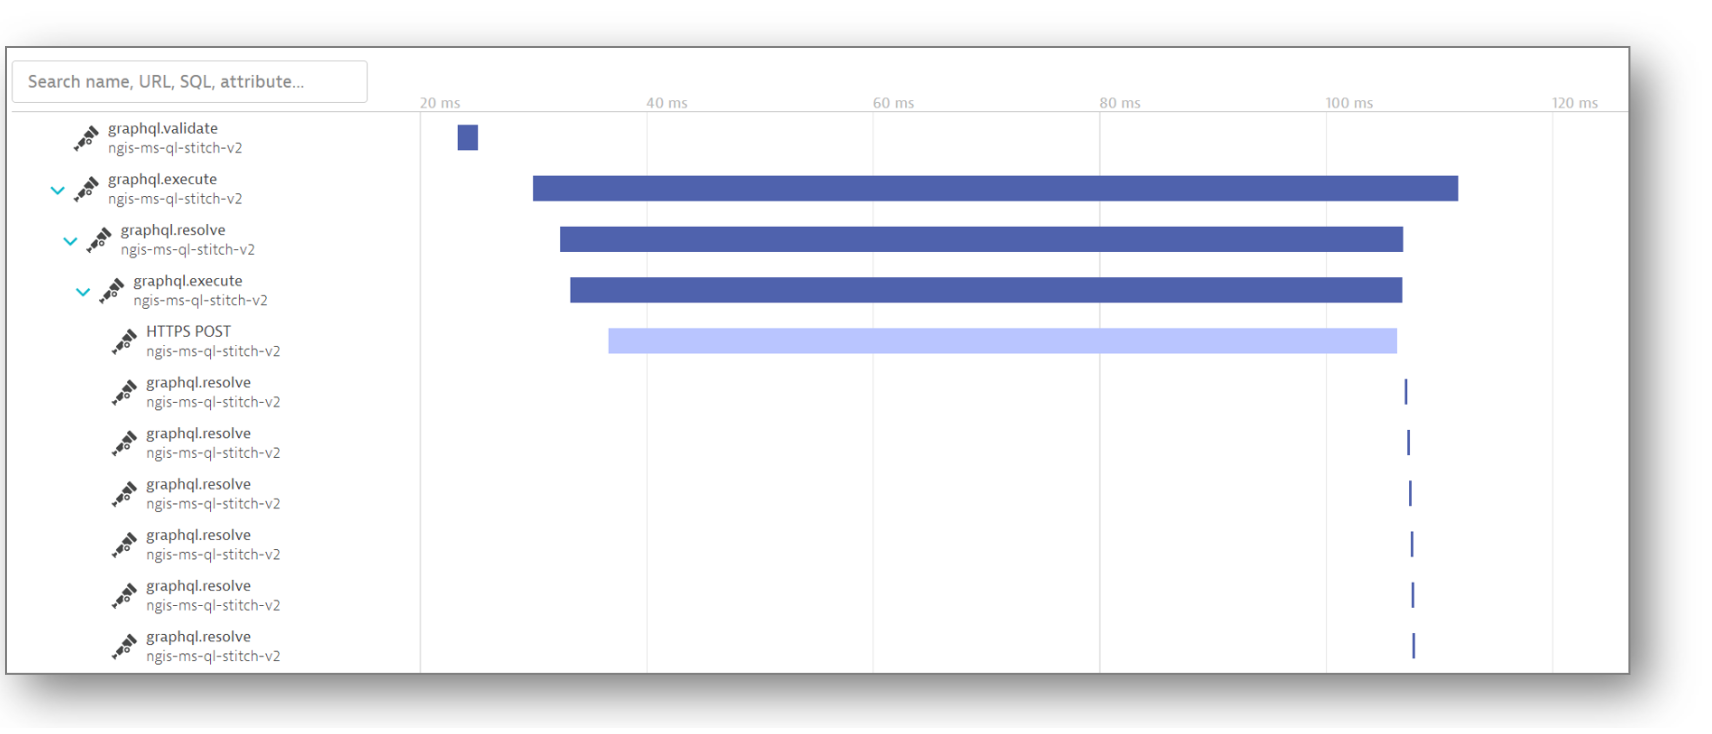
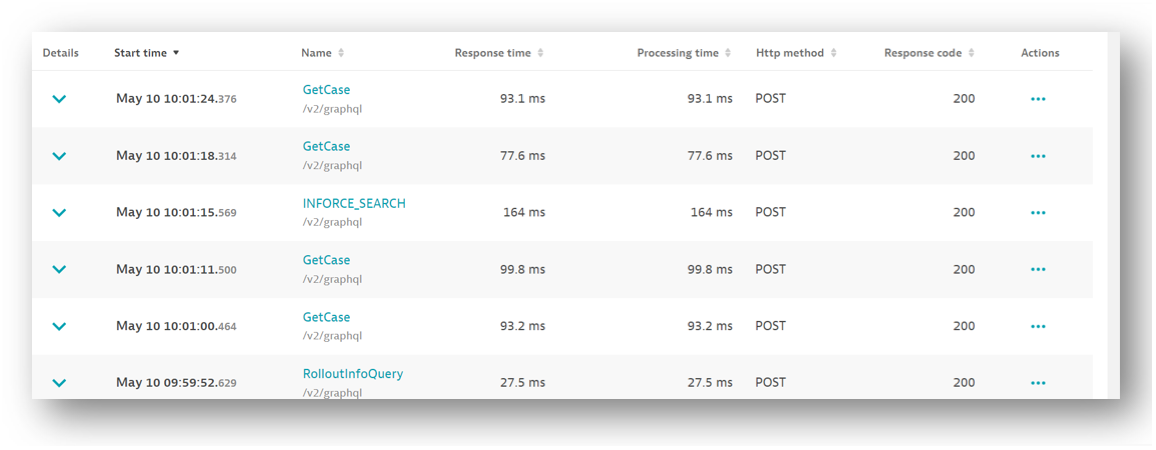
But one blind spot remained. Scherer and his team use GraphQL, a tool for creating APIs, which Dynatrace didn’t support at the time. (Find GraphQL now on Dynatrace Hub.) With GraphQL, “everything is a post request, everything is a single route, everything is a [status code] 200, and you have no idea how it actually works,” Scherer explains. GraphQL even aggregates multiple services into one schema. This is great for API users, but terrible for troubleshooting. In their monitoring feeds, it looked like everything was good with no problems. But they knew that wasn’t the case.
Scherer and his team considered using Prometheus or Jaeger to gain visibility into what was really going on with GraphQL. But as he put it, “It would have been quite a bit of custom code to handle our volume of data.” Dynatrace had already become their one-stop-shop for observability analysis, and they didn’t want to introduce a new data silo. So they turned to OpenTelemetry, which provided a GraphQL plugin. “We now had full-span context for every single one of our GraphQL calls.” This visibility extended across their distributed environment, including AWS Lambda and Microsoft Azure.
Combined observability superpower
With this combined observability superpower, Scherer and his team not only solved their troubleshooting problems, but also evolved their approach. “We were able to rename our requests, so it’s not just a route anymore; it’s actually the operation that occurred,” he explains. “This was a major boon for us.”
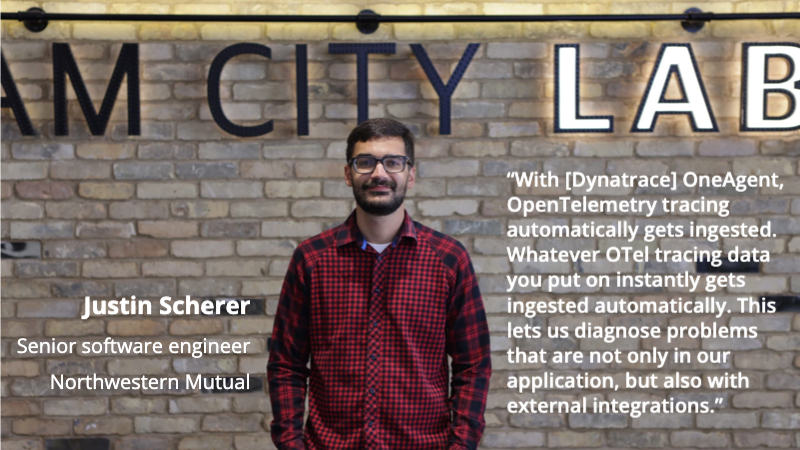
Moreover, Dynatrace combined with OpenTelemetry observability provides the entire organization with a single telemetry solution. “NM has multiple telemetry providers,” Scherer continues. “Because OpenTelemetry is an open specification, most other platforms also support it.” This universality gives Scherer’s team visibility into other teams’ operations and encourages the whole organization to streamline their toolsets. “With OneAgent, OpenTelemetry tracing automatically gets ingested,” he adds. “Whatever OTel tracing data you put in instantly gets ingested automatically. This lets us diagnose problems that are not only in our application but also with external integrations.”
Dynatrace and OpenTelemetry observability: Too much data?
Most organizations report that they’re drowning in data. Indeed, with their new GraphQL instrumentation enabled by OpenTelemetry observability, Nortwestern Mutual traces can be more than 1,000 spans long. Just one GraphQL entry point gets 36,000 requests per hour and results in 36,000,000 spans. “You may think, that’s a ton of data. Why are you gathering all that?” Scherer says. “But any one of those fields could be a problem. We need to make sure every one of them is responding as quickly as possible.”
With their previous observability solution, Scherer and his team weren’t getting enough data. Now some might say they’re getting too much. “I’d rather have too much data than not enough,” Scherer says. With Dynatrace, that breadth of data in the Grail data lakehouse and Davis AI immediately pinpoint what matters with forensics-level detail. In turn, this saves Scherer’s team time and effort they can spend on automating, innovating, and driving adoption.
Next on Scherer’s agenda: Using the metrics API to track deprecated fields, migrating logging into the OTel collector, and making OpenTelemetry the standard across the organization. He and his team also plan to contribute to the OpenTelemetry project. “We believe in open source,” Scherer says. “We also believe in OpenTelemetry. And we plan on giving back as much as we possibly can.”


Looking for answers?
Start a new discussion or ask for help in our Q&A forum.
Go to forum