
The Dynatrace metric browser is a centralized place in the web UI to view all metrics in your environment and access metric details and action links. Powerful filters enable you to find metrics of interest easily.
Recently we simplified observability for custom metrics and opened up Dynatrace OneAgent for integration of metrics from various sources like StatsD, Telegraf, and Prometheus. Dynatrace customers with the largest of environments use our new metric ingestion API to push metrics into Dynatrace, while the Dynatrace Software Intelligence Platform ensures that all metrics benefit from platform capabilities, such as context-aware Davis® AI analytics or the ability to implement fine-grained access control.
With an increasing number of metrics from different sources now available on the Dynatrace platform, we want to give all metrics a new, central home in our web user interface, a home that easily allows you to find the right metric, with useful insights and actions at your fingertips. We’re therefore happy to introduce the new metric browser, available as an Early Adopter release with Dynatrace version 1.207.
Explore the metrics you’re most interested in with the new metric browser
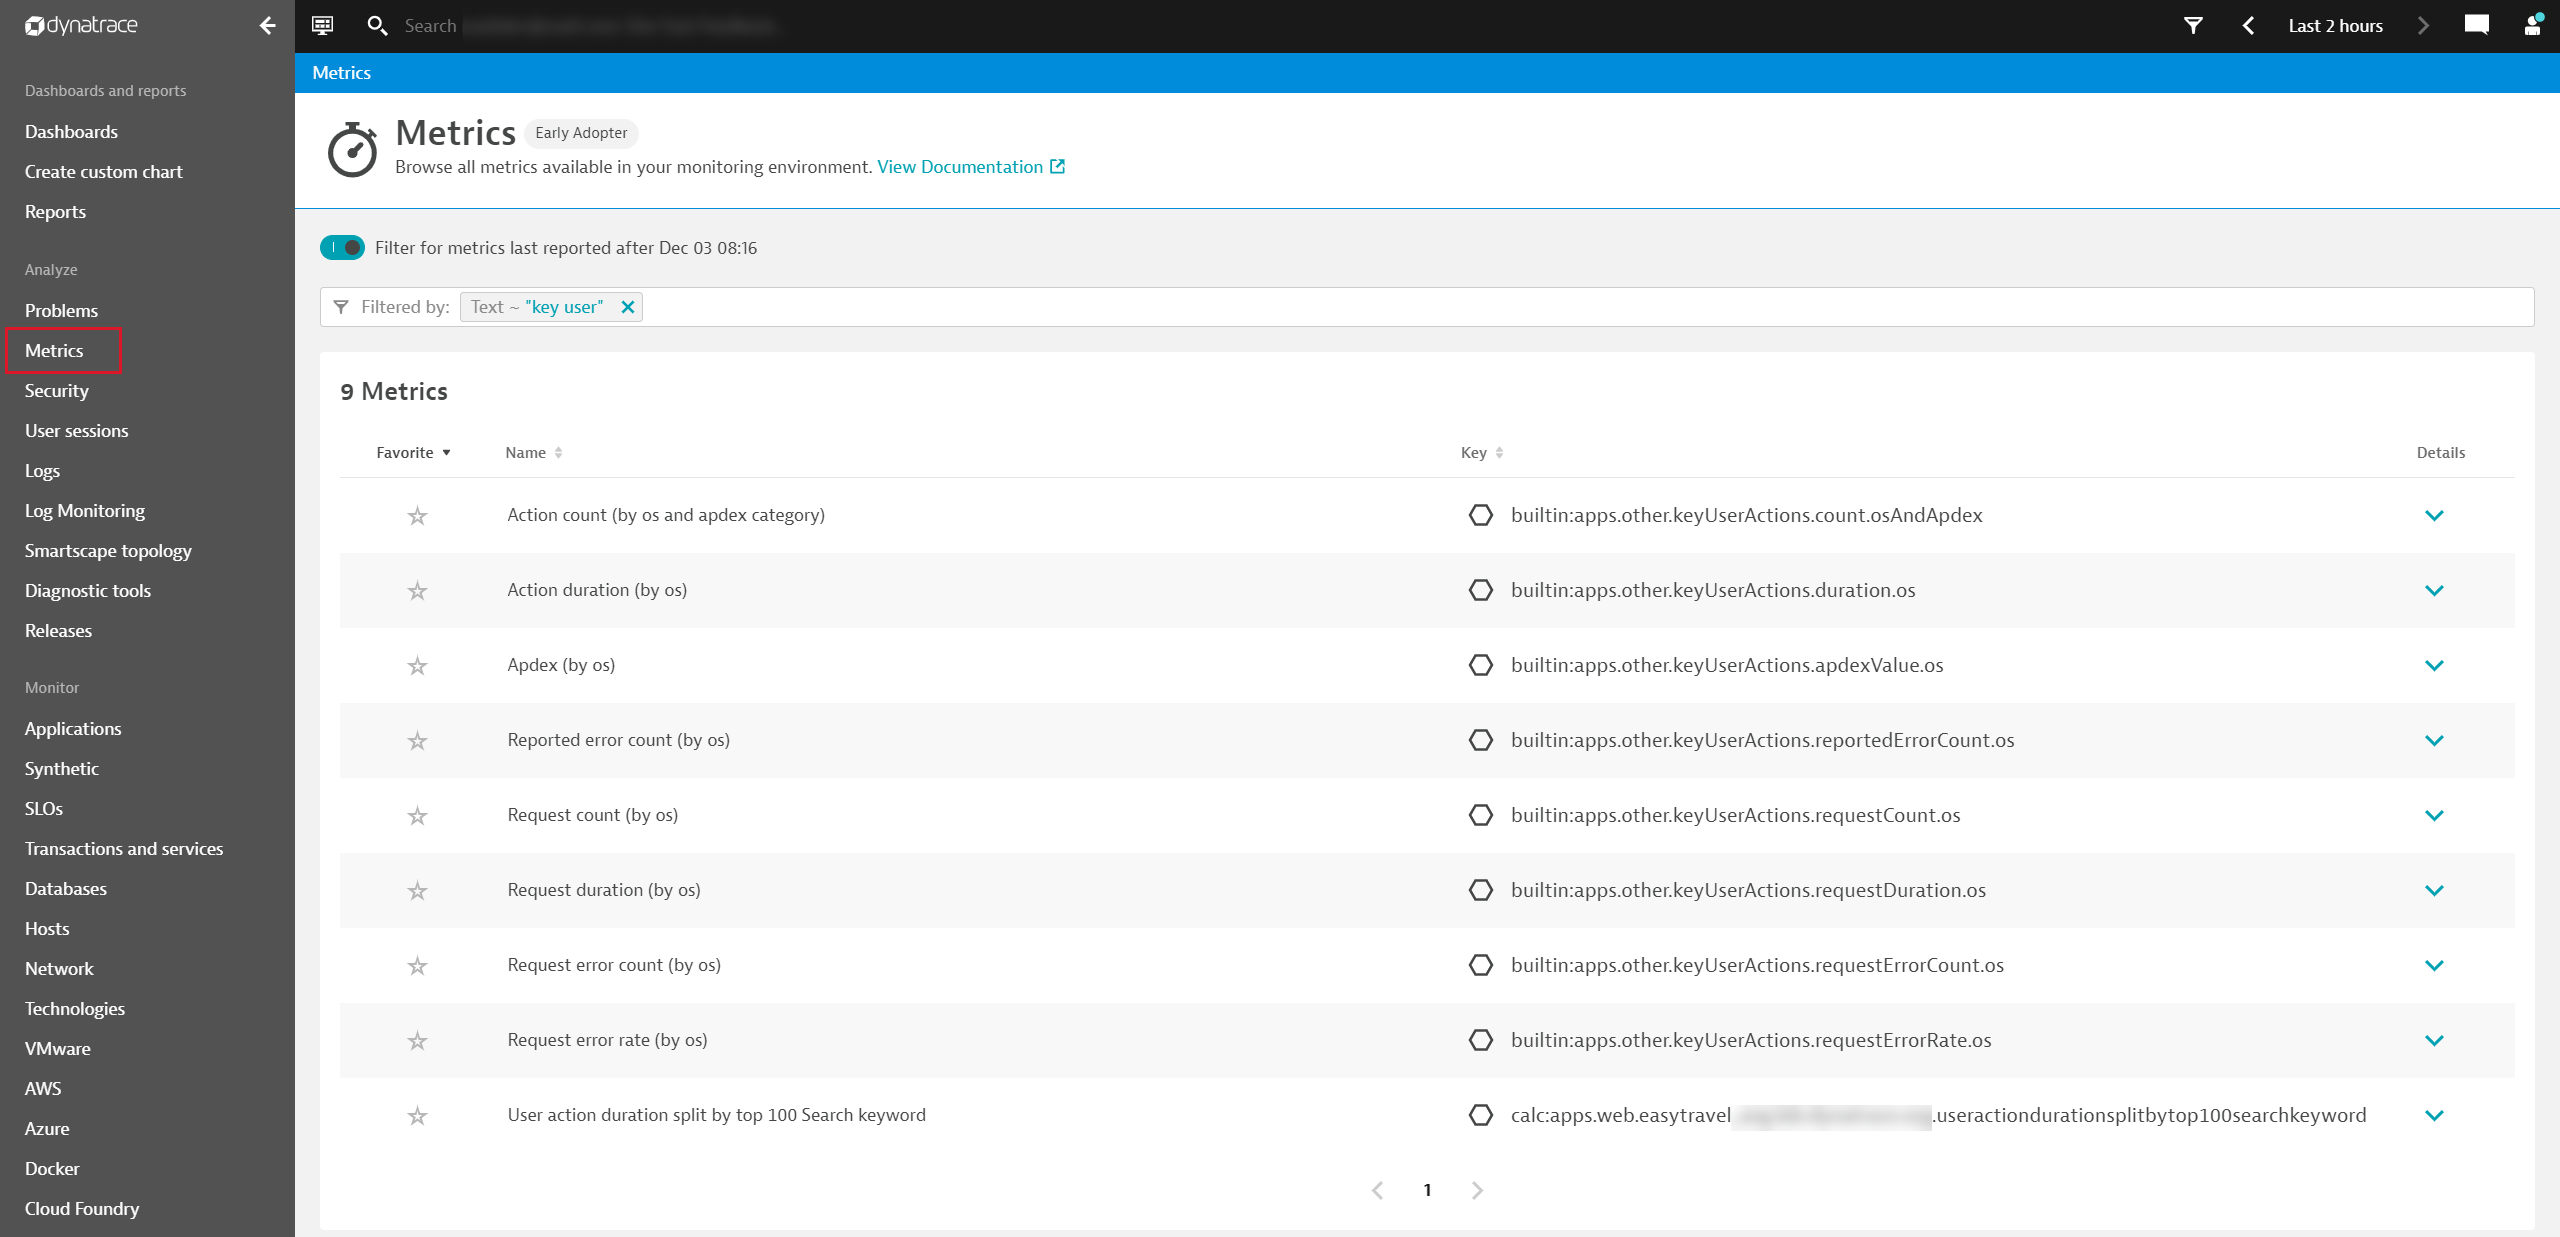
- As an application owner you might want to explore which key user metrics are available so you can add them to your dashboards, but you might not know the exact names of the metrics. Now you can use the text search to find metrics that have “key user” either in their names or descriptions. Browse through the matching results, pick the metric of your choice for further charting and dashboarding, or simply mark the metric as a favorite so you can easily access it later.
- As a developer, you might want to verify that specific metrics that are ingested via a newly developed integration have been successfully created and that data points as well as metric dimensions are correctly defined. A quick search for your defined metric-key prefix shows you a list of all matching metric keys. You can also drill down to view metric insights and details such as the last-written timestamp or a preview chart to verify that data points were correctly sent to Dynatrace. Interested only in metrics reported during the last two hours? We’ve made sure that you can now explore metrics reported during a certain timeframe as well.
Easily find the metrics you’re interested in
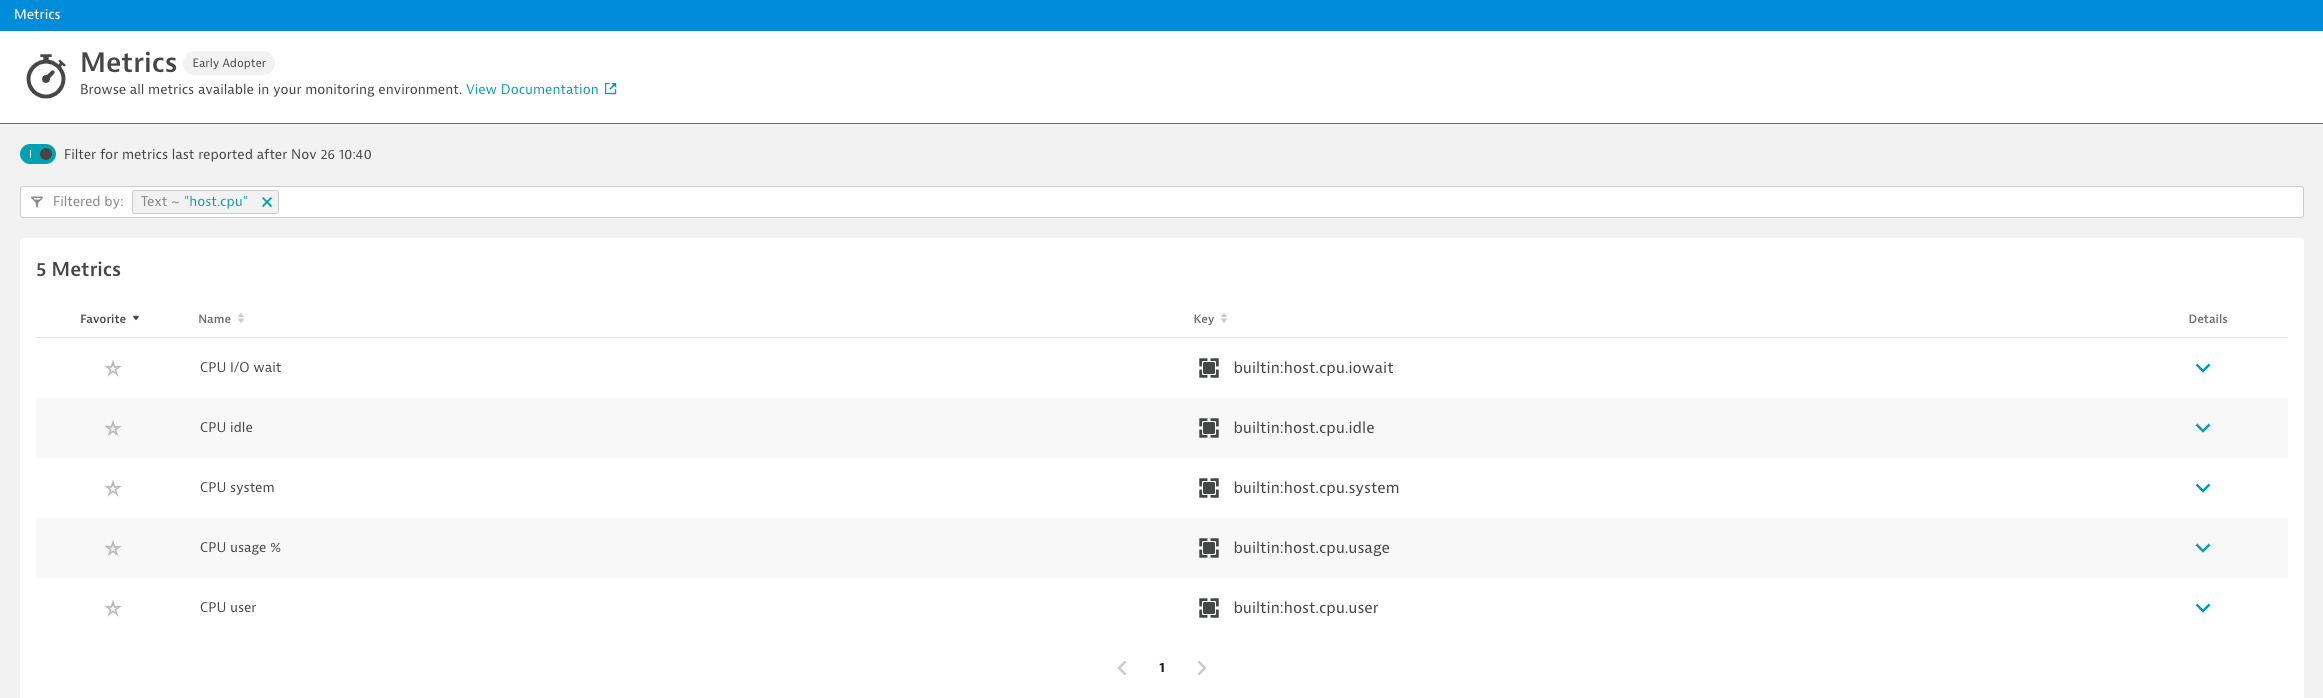
Whether you’re looking for a specific metric key, want to list all metrics related to the string host.cpu, or you’re looking for more details about a metric called Action count, the metric browser can help you.
We’ve implemented the same top-level filter bar concept as we have for other views such problems or logs so that you can perform a text search for metrics by metric key, metric name, or description. The search can be applied to all metrics that exist in your Dynatrace environment, whether OneAgent- or ActiveGate-provided metrics, calculated metrics, metrics provided by a JMX extension, or all other custom metrics ingested into Dynatrace.
Explore metrics reported during a specific timeframe
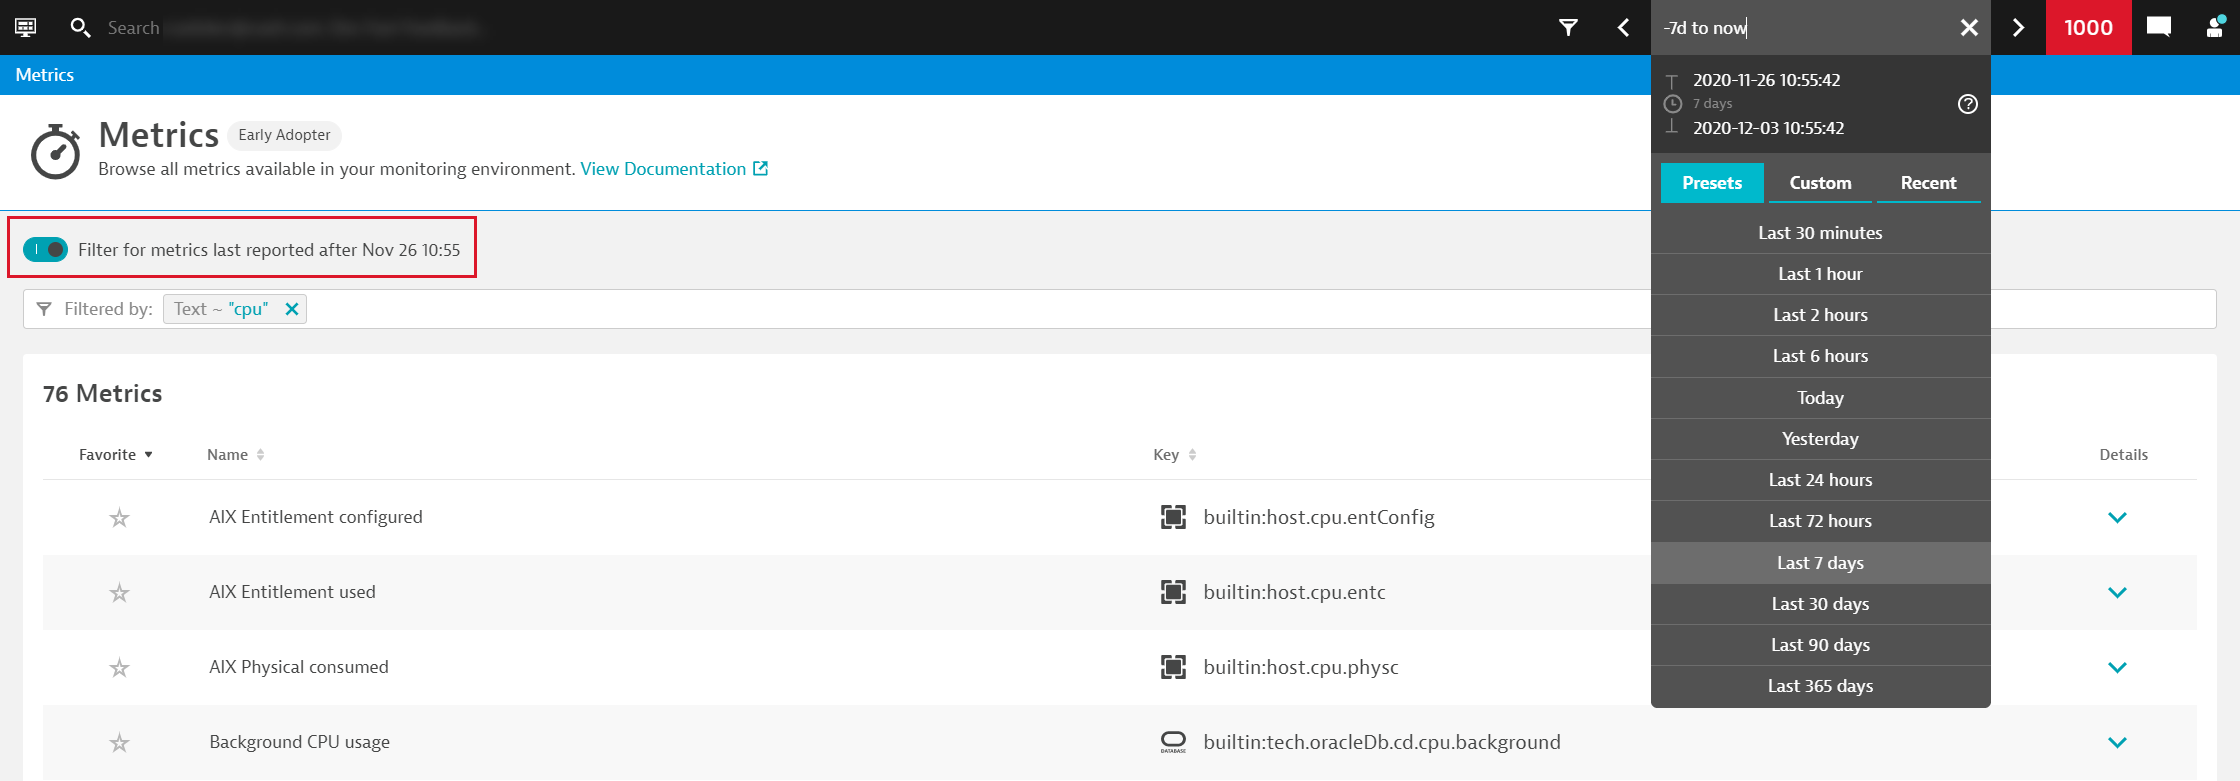
If you’re only interested in metrics that are active and for which data was recently received in Dynatrace, turn on the Filter for metrics last reported… toggle to focus your search results.
By default, only those metrics that are reported after the specified date/time are shown. This ensures that the most relevant metrics are displayed first. The filter time can be configured by choosing a different start time in the timeframe selector.
Note that if you turn off the toggle, all metrics matching your filter criteria are shown.
Drill down and retrieve details about a specific metric
If you want more information about a specific metric, you can easily drill down to metric details such as description, unit, existing data dimensions, or available data aggregations. Such metadata enriches metrics with useful technical details in case you want to query data using the Metrics API v2.
To complement the metric information on the left, you can see a chart preview of the selected metric on the right. The preview always charts the metric for all entities matching your selected management zone and timeframe.
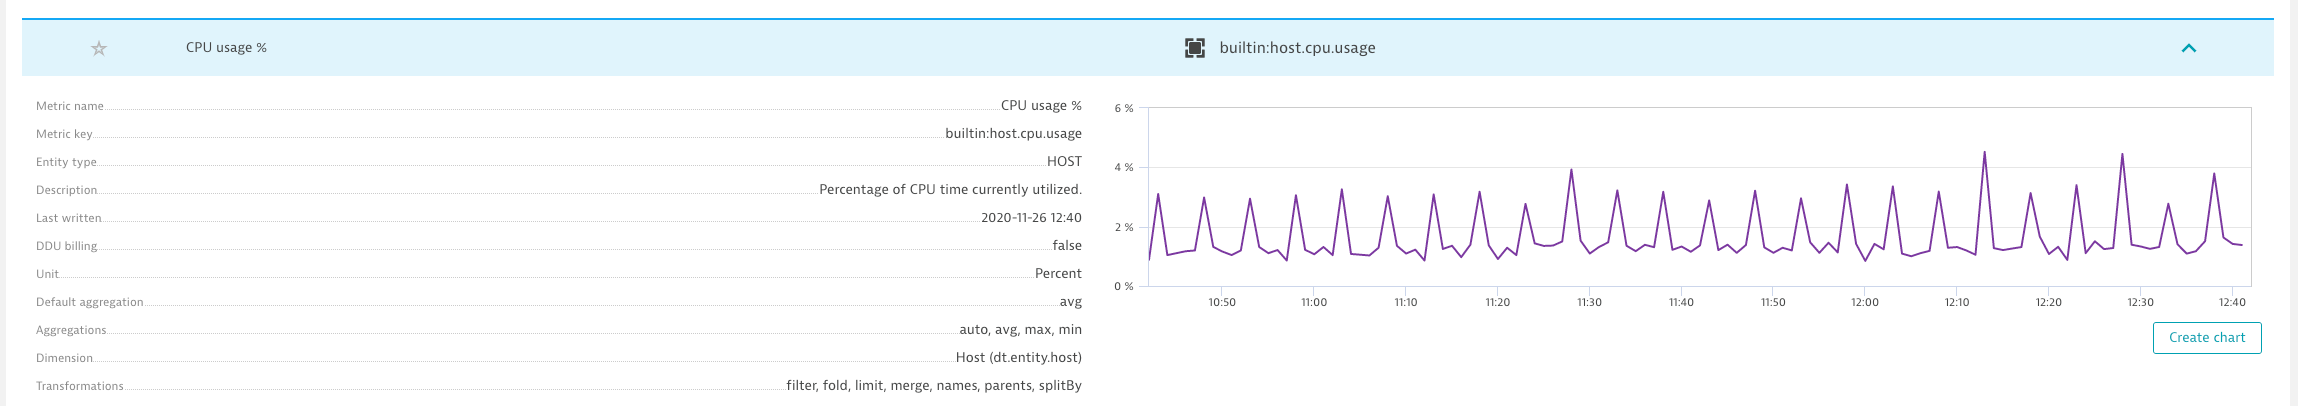
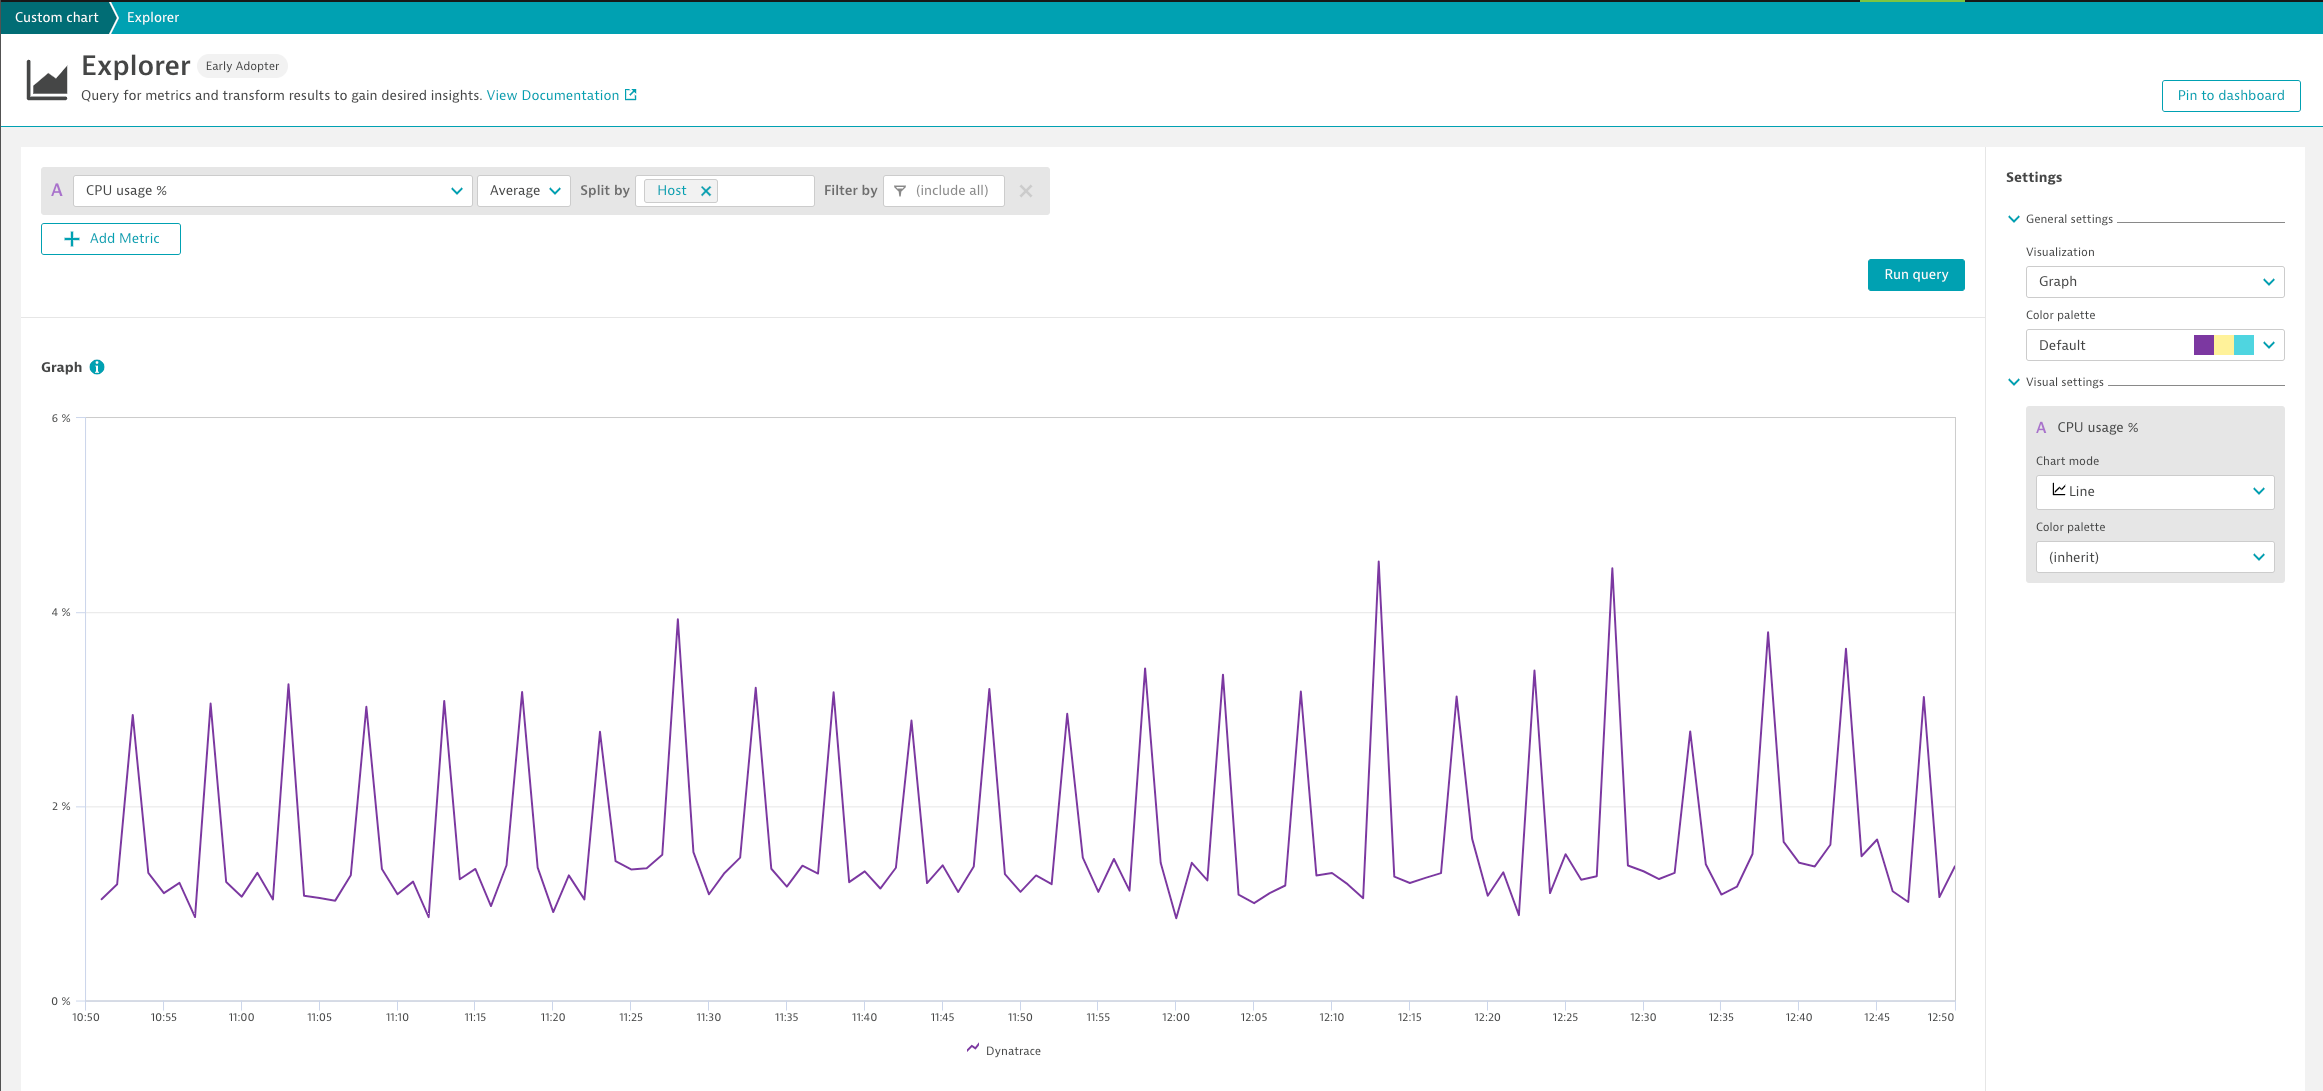
To further analyze the selected metric, select Create chart to go to the new Data explorer. Here you have access to more analytics such as selecting different time and space aggregations or data filters (for example, by host, process, or custom dimensions).
Quickly access the most important metrics by marking them as favorites
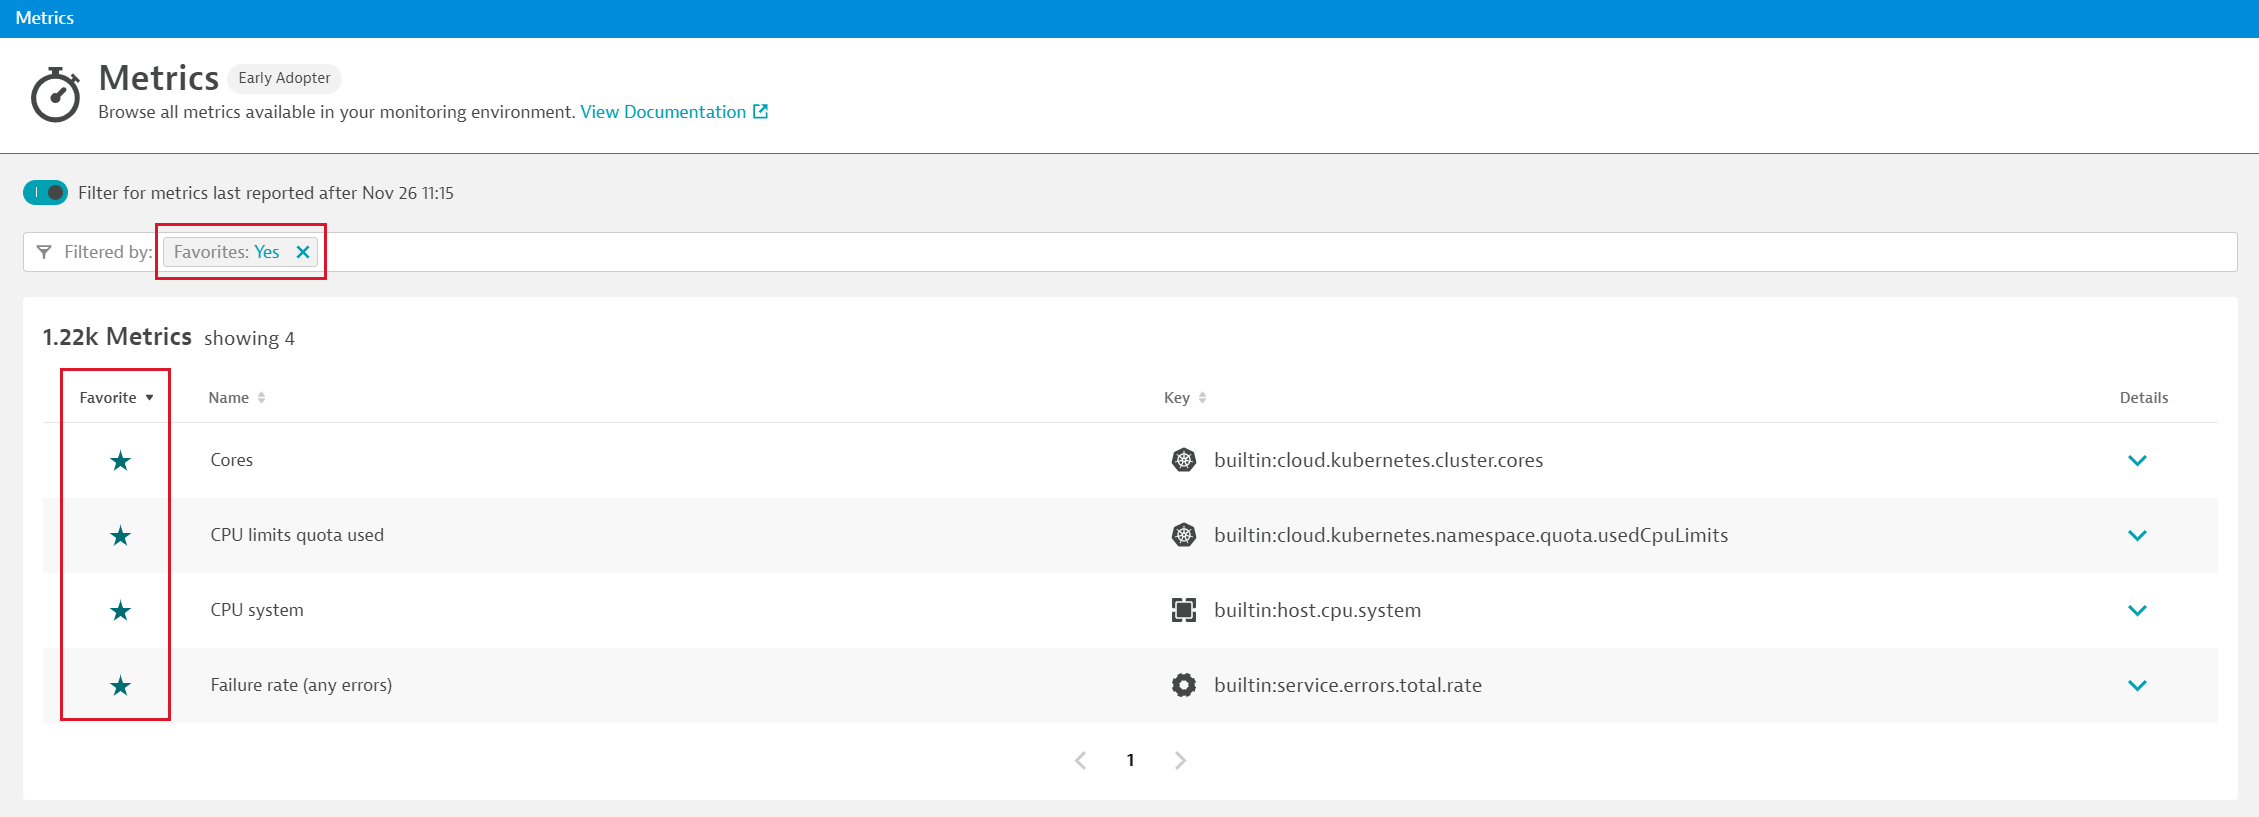
You can mark the most important and interesting metrics as favorites. Metric favorites are always displayed at the top of the results page. You can even explicitly filter for favorite metrics, as shown below.
What’s next
In future releases, we plan to provide even more descriptive information for metrics, such as customizable tags and minimum/maximum values. These details will all be available in the metric browser search and detail views.
In addition, we’ll also provide links to related product views, making it easier for you to, for example, create custom alerts for specific metrics or visit the Davis data units overview page to view monitoring consumption details.
Your feedback matters
We hope you like the new metric browser and we look forward to hearing your comments and questions. Please post your feedback for us at Dynatrace Community.


Looking for answers?
Start a new discussion or ask for help in our Q&A forum.
Go to forum