
Broad adoption of cloud-native technologies—especially Kubernetes—presents a variety of challenges, ranging from cluster instability to code complexity and more. The new Dynatrace Kubernetes experience enables platform engineers and SREs to better understand and optimize the health and performance of their Kubernetes environments.
As with all new tech, implementation and understanding don’t occur overnight. The adoption process takes time and consideration. While more investments are being directed towards Kubernetes-native or cloud-native methods, the challenges in using Kubernetes remain. Its complex, distributed nature makes it difficult to use and understand.
The complexity and numerous moving parts of Kubernetes multicloud clusters mean that when monitoring the health of these clusters—which is critical for ensuring reliable and efficient operation of the application—platform engineers often find themselves without an easy and efficient solution. This creates a lack of insight into Kubernetes platform health and the potential issues that can arise.
Gain comprehensive visibility into your Kubernetes clusters
As organizations continue to adopt Kubernetes-centric infrastructure, it’s increasingly crucial that their platform engineers have the right tools and capabilities to properly manage and track their Kubernetes clusters end-to-end.
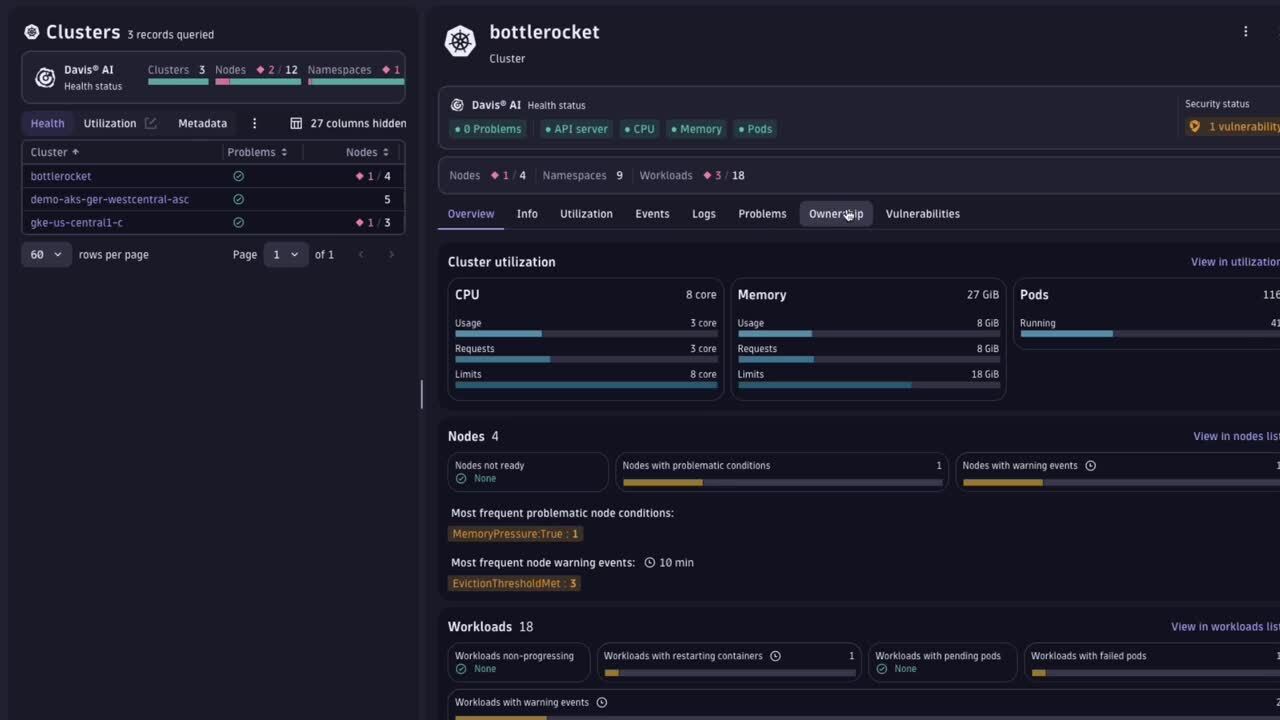
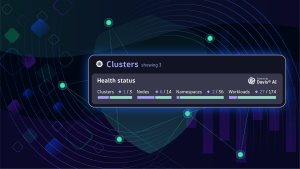
The new Dynatrace Kubernetes experience provides a 10,000-foot view of all Kubernetes clusters, across all environments and distributions (from GCP, Azure, and AWS to OpenShift or on-premise solutions. The platform allows engineers to both look across and drill down to quickly identify problem nodes, issues, and the underlying root causes for faster mean time to resolution (MTTR).
For any organization, maintaining a fast MTTR and customer happiness is critical. The enhanced web UI and out-of-the-box health signals give engineers the ability to easily understand which clusters are experiencing issues and negatively impacting customer experience. Additionally, the auto-baselining of performance and automated alerts allow engineers to understand issues within any of their clusters before they become serious or result in outages.
All the data a platform engineer needs to understand what’s going on can easily be seen in one place. This is a revolutionary improvement for platform engineers and R&D teams in general. What used to take a lot of valuable time, resources, and tools is now available in one central place.
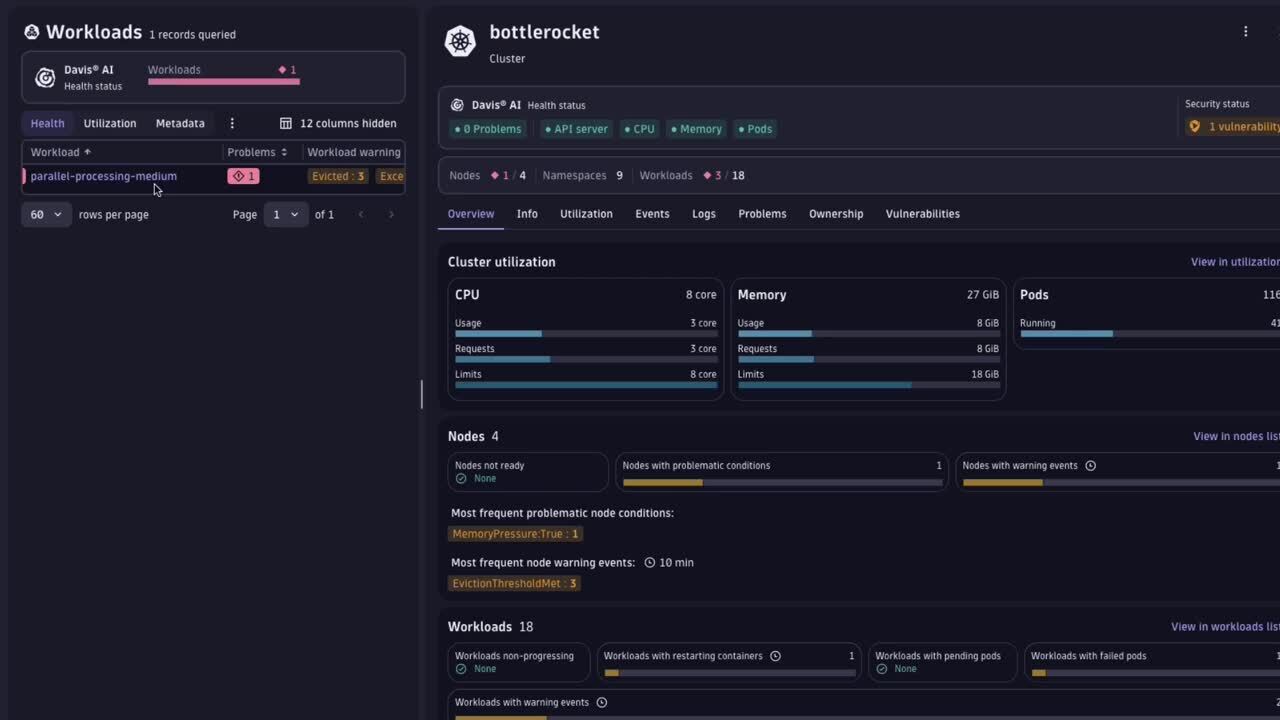
When working with Kubernetes, it’s imperative to carefully keep track of what is going on in your clusters to ensure optimal health and efficiency. For instance, pods of misconfigured workloads can render the nodes they are running on unhealthy. Such critical situations are signaled by warning events and unhealthy node conditions. Engineers get a detailed view of a single cluster status, providing insight into the relevant Kubernetes health signals of container resources like nodes, namespaces, and workloads.
The new Dynatrace Kubernetes experience allows engineers to easily drill down to their unhealthy workloads, investigate ongoing issues, and gather all information required to fix problems quickly. If an unhealthy workload is owned by another team, having access to the provided ownership information enables engineers to promptly notify the correct team, ensuring a faster, more efficient resolution process.
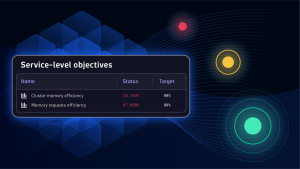
Optimize resource utilization across workloads
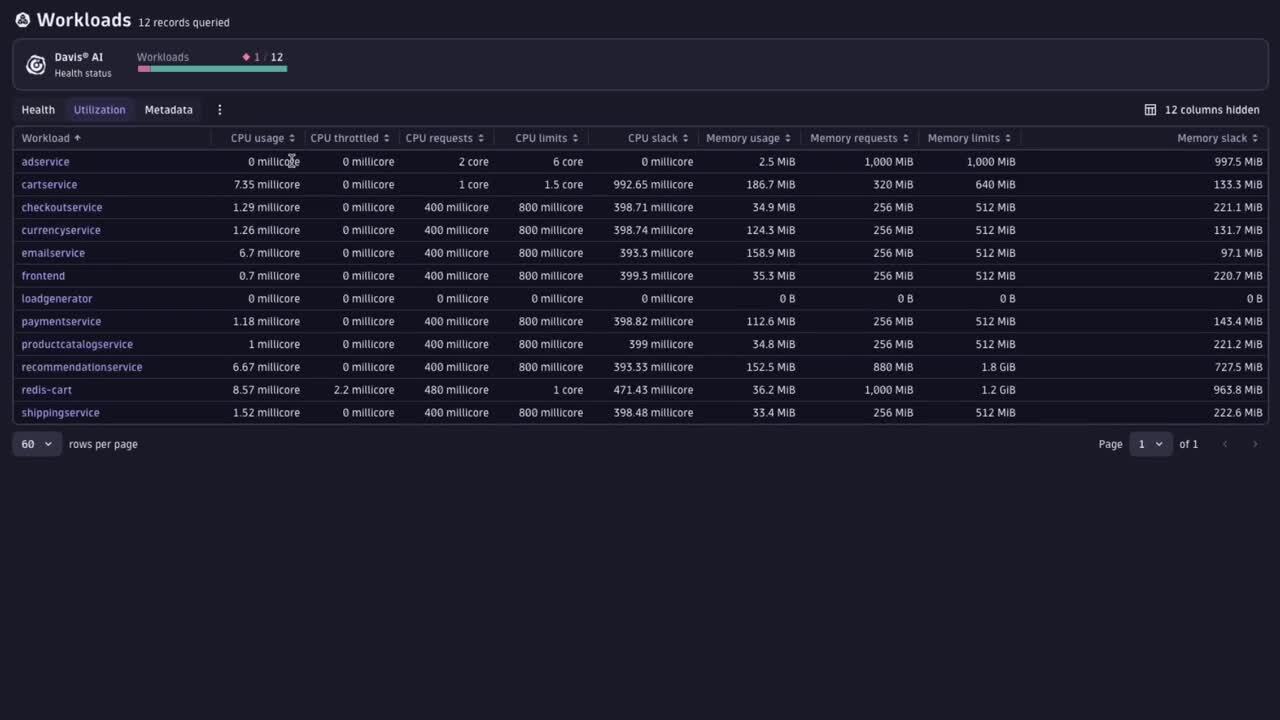
In addition to the complexity that makes assessing the ongoing state of cluster health challenging, engineers face the issue of runaway cloud costs due to inefficient resource utilization. Platform engineers size their Kubernetes clusters based on the workload’s resource requests. As these engineers often manage a large fleet of clusters, node-scalers are frequently used to automate the task of dynamic optimization. However, if workload owners underutilize the requested resources, the platform wastes an incredible amount of unused resources, leading to an unnecessarily high carbon footprint and abundant cloud costs.
The ability to switch to the resource perspective helps engineers to easily assess the current state of resource efficiency of their Kubernetes environments. This allows for a fast drill-down to determine the workload contributing most to the situation, whether it’s CPU or memory waste. By using the available ownership information, teams can quickly and immediately begin to collaborate on optimizing these workloads.
Onboarding is faster than brewing a cup of coffee
Onboard a new Kubernetes cluster in three minutes. Yes, it only takes three minutes to activate Dynatrace Kubernetes Observability. It doesn’t matter which distribution you use, and no documentation is needed.
During onboarding, you can easily and seamlessly add Dynatrace Application Observability functionality like automated distributed tracing and code-level visibility to enhance workload health and performance.
Good product experiences go hand-in-hand with good pricing
That’s why the full Kubernetes Observability experience—which includes Kubernetes monitoring and application observability—is set at a price that is simple and transparent. Pricing relies on two key pillars:
- Predictable pricing for monitoring Kubernetes cluster health based on pod-hours. The longer a pod is monitored, the more pod-hours are consumed. Dynatrace pricing is independent of pod sizes or the number of nodes. It seamlessly works with all types of Kubernetes environments, whether they are fully managed (for example, GKE-Autopilot, EKS, AKS) or self-managed (on-premises or in the cloud).
- Flexible, consumption-based pricing for applications running on Kubernetes. Pricing is based solely on the memory used by the containerized applications that you are monitoring. Dynatrace Kubernetes cluster onboarding is rolling out its Full-Stack Monitoring mode in such a way that OneAgent code modules are only deployed to selected application pods.
All this is done automatically, simply, and conveniently. So, stop waiting. Embrace the experience of Dynatrace’s comprehensive Kubernetes observability offering and gain insights into your running workloads, pods, containers, and more.
What’s the next step in ensuring your Kubernetes health?
- The Kubernetes Observability app requires the latest Dynatrace platform, powered by Grail™, and a Dynatrace Platform Subscription. For more details, take a look at this blog post in the Dynatrace Community.
- You can find out more about the Kubernetes app in Dynatrace Documentation. For monitoring consumption documentation, see Container monitoring (DPS).
- Want to try it for yourself? Check it out here.

Looking for answers?
Start a new discussion or ask for help in our Q&A forum.
Go to forum