
When It comes to IT infrastructure, simplicity and efficiency are paramount. We're excited to introduce the Dynatrace ActiveGate Nutanix Cluster Extension. This extension is designed to simplify the monitoring of your Nutanix clusters, providing you with all the insights you need to keep your operations running smoothly. The extension includes out-of-the-box dashboards, making setup a breeze.
Easily monitor your Nutanix clusters with Dynatrace
The Dynatrace Nutanix Cluster Extension offers straightforward yet powerful features to help you streamline your monitoring with an easy one-click activation via Dynatrace Hub. (Select Hub from the dock in the Dynatrace web UI. Then, search for Nutanix Clusters.)
The extension automatically gathers real-time performance data from your Nutanix clusters to monitor resource usage, cluster health, and more, all in one place. Thanks to Davis® AI-powered algorithms, Dynatrace can identify issues before they become problems and suggest optimizations tailored to your environment, such as adjusting a vDisk that runs at its Input/Output Operations per Second (IOPS) limit, which could cause problems further up the stack.
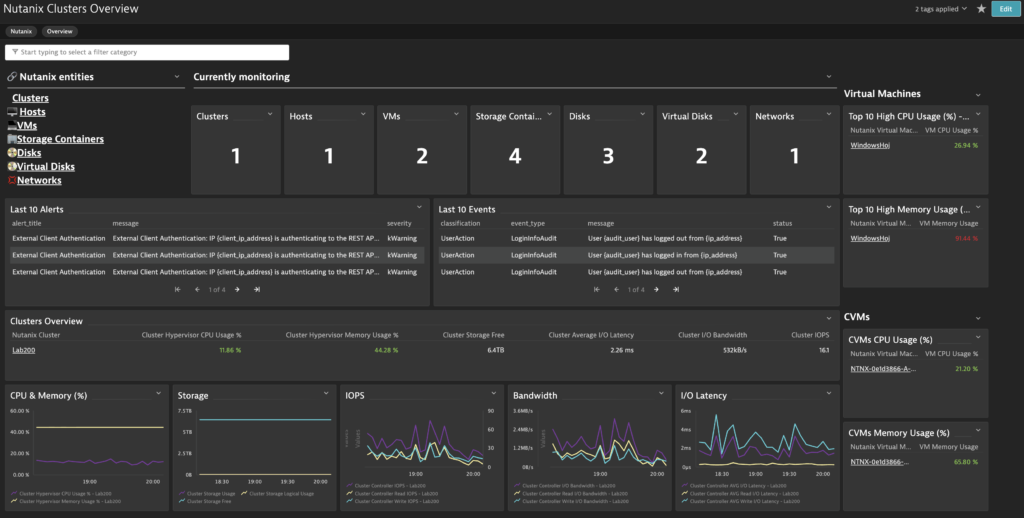
As with other Dynatrace extensions, the Nutanix Cluster Extension provides out-of-the-box dashboards so you can start monitoring your Nutanix clusters with minimal setup. You can use the pre-configured dashboards as-is, adapt the dashboards to your specific needs, or create custom dashboards to display the information that’s most relevant to your operations.
Only a unified view can help solve problems
Many companies are dealing with the challenges of complex multicloud environments in the modern business landscape. Understanding what’s happening across these diverse environments can be tricky. Often, organizations resort to using separate tools for different parts of their technology stack. However, this approach doesn’t provide seamless monitoring coverage.
Imagine this scenario: your application frontend is hosted in a public cloud Platform-as-a-Service (PaaS), while the backend operates within a Nutanix cluster. How can you effectively connect the dots and pinpoint the root cause when something goes wrong?
Dynatrace and the Nutanix extension provide you with a comprehensive view that spans on-premises, hybrid, and public cloud environments. Dynatrace, in tandem with the Nutanix extension, simplifies performance monitoring and makes issue identification and resolution more efficient.
Get ready for Nutanix insights: Here’s how Dynatrace helps
The extension comes with a comprehensive set of essential metrics that can quickly identify the root causes of performance issues, saving time and minimizing disruptions. By integrating Nutanix metrics into Dynatrace, you can gain valuable insights into the performance and health of your Nutanix infrastructure.
With Dynatrace, Nutanix metrics can be leveraged for various use cases.
Performance monitoring
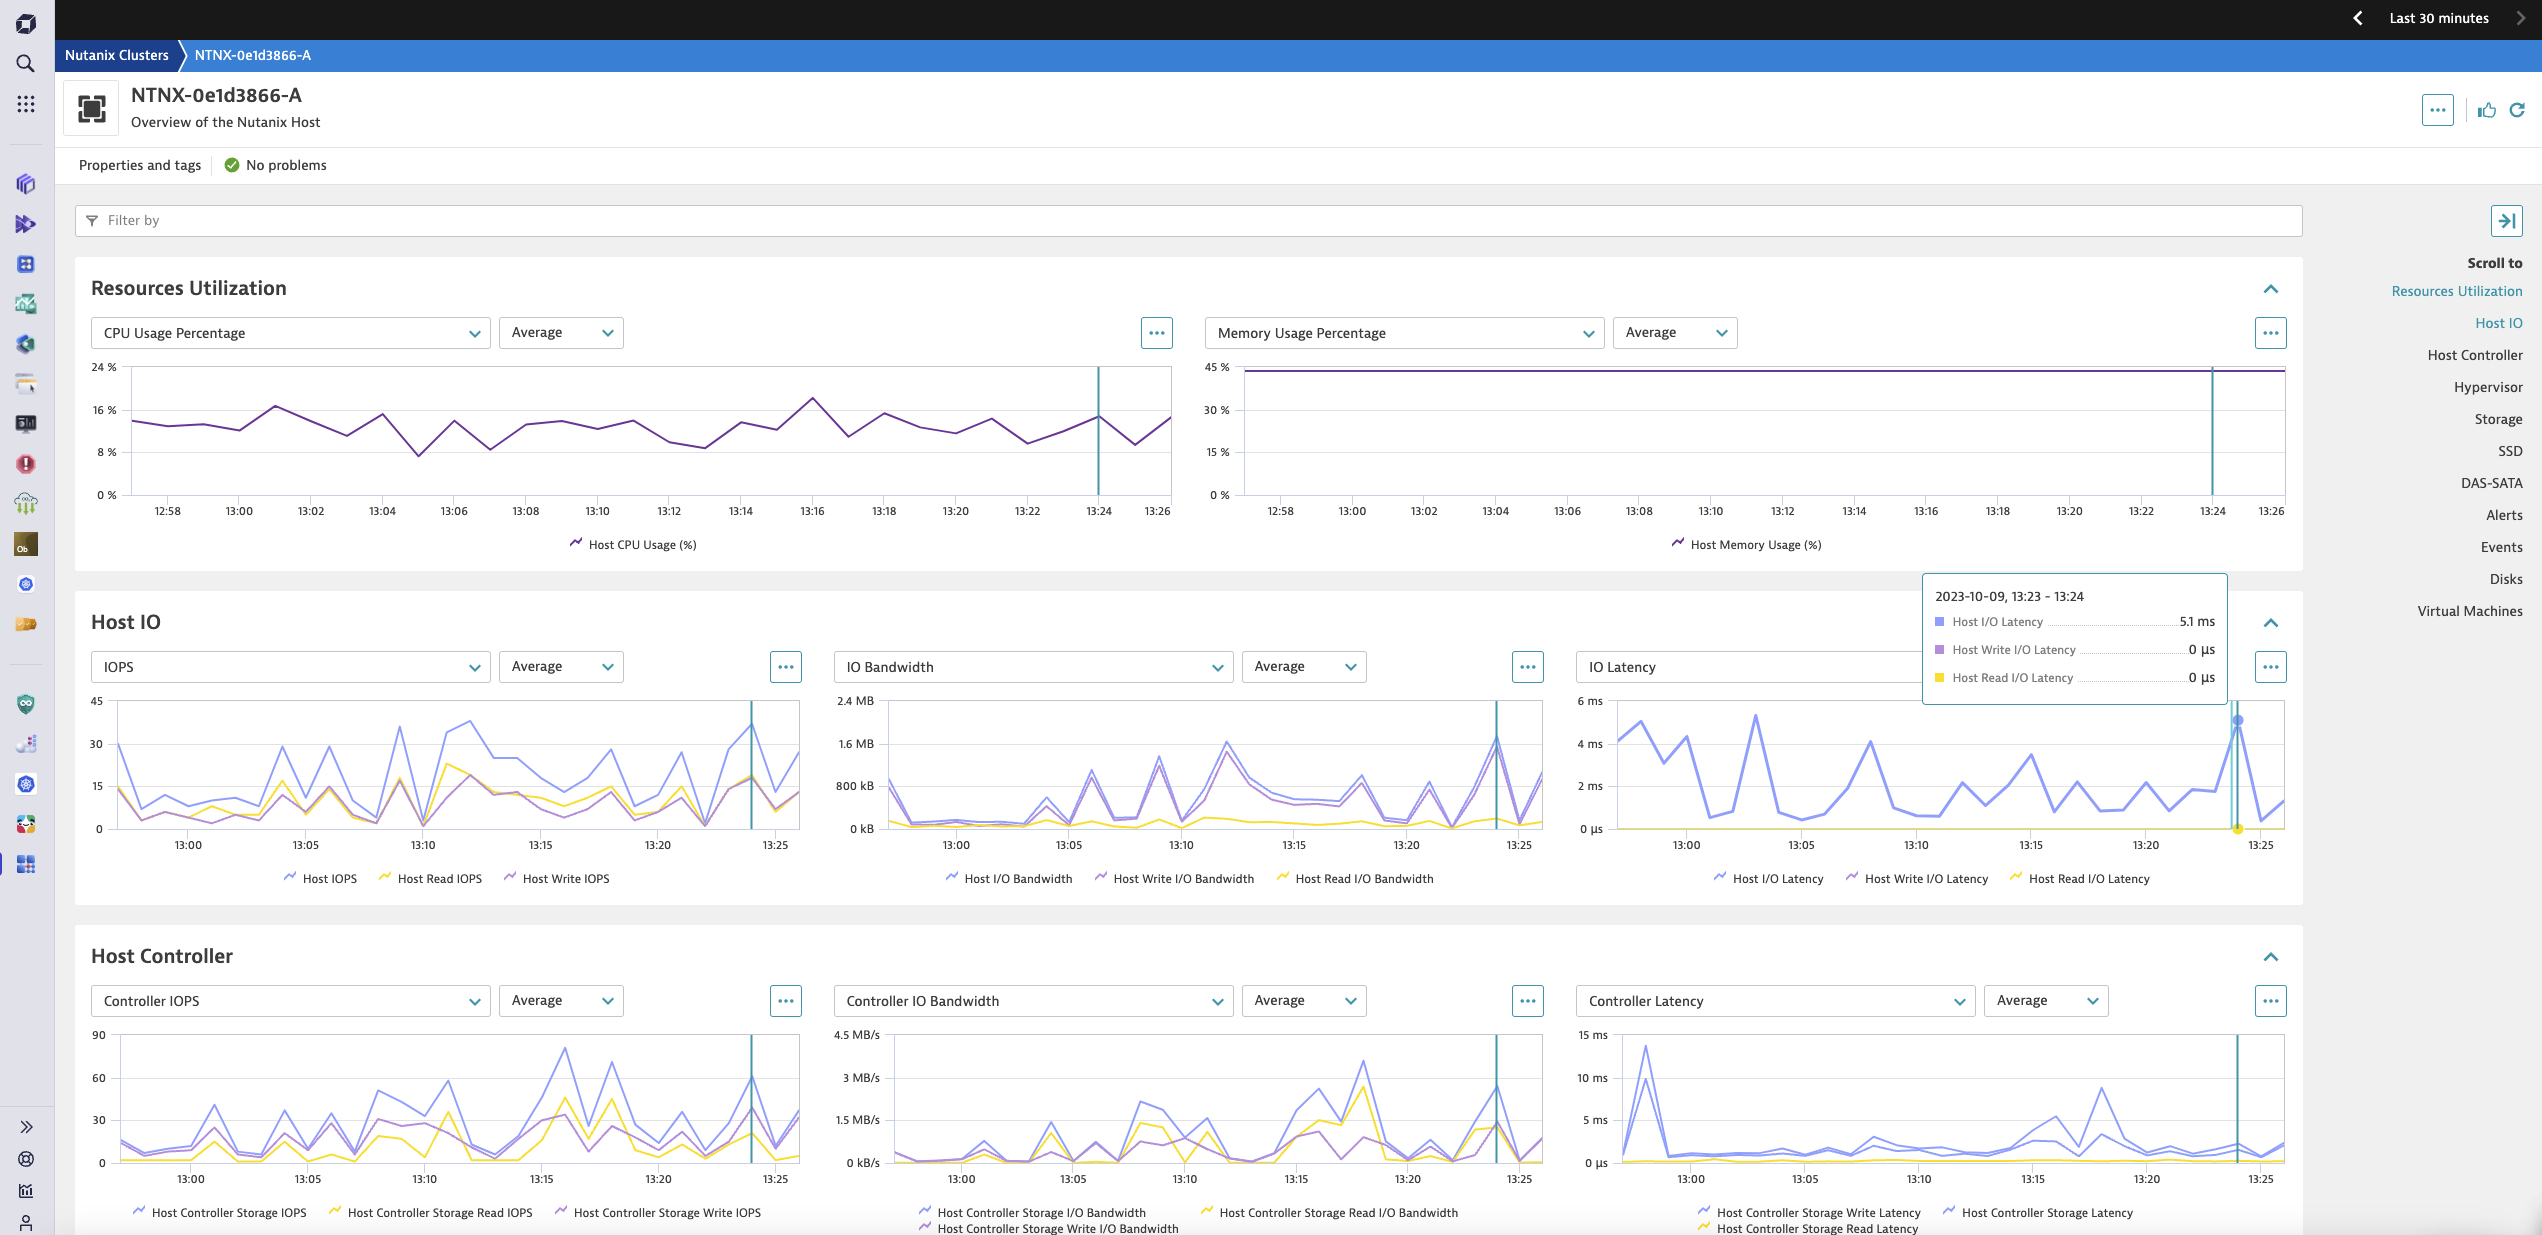
Dynatrace can collect performance metrics from Nutanix clusters, including latency, IOPS (Input/Output Operations Per Second), and network throughput.
This enables organizations to monitor the performance of Nutanix infrastructure in real-time, identify performance bottlenecks, and take preventive, corrective actions.
Fault detection and troubleshooting
Integrating Nutanix metrics into Dynatrace allows for detecting anomalies and issues within Nutanix clusters.
This helps IT teams quickly identify and troubleshoot problems, reducing downtime and ensuring the availability of critical applications.
User experience optimization
By correlating Nutanix metrics with application performance data in Dynatrace, organizations can ensure a seamless user experience so IT teams can quickly identify and resolve issues that impact application performance and thereby improve user satisfaction.
Custom alerting and automation
Dynatrace allows organizations to set up custom alerts based on Nutanix metrics, triggering automated actions when thresholds are breached; this enables proactive issue resolution and reduces manual intervention.
Collected metrics types
With a comprehensive set of metrics at your fingertips, you can proactively manage your Nutanix clusters, identify potential issues before they impact operations, and optimize your infrastructure for peak performance.
| Metric type | Description |
| Host metrics | Monitor the performance of individual hosts within your clusters, identifying any potential issues or bottlenecks. |
| Virtual machine metrics | Gain insights into the performance of your virtual machines, ensuring that your applications run smoothly. |
| Storage container metrics | Track the usage and performance of storage containers to optimize resource allocation. |
| Disk metrics | Monitor the performance of disks to ensure efficient data storage and retrieval. |
| Virtual disk metrics | Keep tabs on virtual disk performance, identifying any potential storage bottlenecks. |
| Network metrics | Gain visibility into network performance, helping you ensure smooth data transfer and communication. |
| GPU metrics | For organizations utilizing GPUs, monitor GPU performance to optimize resource allocation for graphics-intensive tasks. |
| Alert metrics | Receive real-time alerts based on predefined thresholds, allowing you to take immediate action when performance issues arise. |
| Event metrics | Access event data to gain insights into system events and changes, helping you track and troubleshoot issues effectively. |
Start monitoring Nutanix with Dynatrace
The Dynatrace Nutanix Cluster Extension offers a simple yet effective solution to the challenges of monitoring Nutanix clusters. It empowers your organization with valuable insights, enhances performance, and saves time and resources.
For full details, go to Dynatrace Hub.
This extension works seamlessly with Dynatrace SaaS, ensuring flexibility and compatibility with your preferred monitoring environment.
Thank you for taking the time to explore the latest Dynatrace offering for Nutanix cluster insights. We hope this extension simplifies your IT operations, allowing you to focus on what matters most. If you have any questions or want to explore the extension further, please contact our team. We’re here to help you achieve more with less effort.


Looking for answers?
Start a new discussion or ask for help in our Q&A forum.
Go to forum