
A common challenge of DevOps teams is they get overwhelmed with too many alerts from their observability tools. The problem is a lack of enough context about the problem’s impact and the actual root cause. DevOps teams don’t need just more noise—they need smarter alerting that is automatic, accurate, and actionable with precise root cause analysis.
Root cause analysis is often hampered by a lack of timely information, the involvement of multiple tools, or conflicting sources of truth.
Getting the information and processes in place to ensure alerts like this example can be organizationally difficult. Getting the right information from different teams and ensuring it’s reliably attached to entities requires coordination and communication. While you’re waiting for the information to come back from the teams, Davis on-demand exploratory analysis can proactively find, gather, and automatically analyze any related metrics, helping get you closer to an answer. In this post, I’ll show you how to enrich your alerts and take things to the next level of effectiveness.
What you need to know for root cause analysis
For timely and effective root cause analysis when an issue occurs, it is critical that you have access to certain information, for example, the following:
- What went wrong?
- Who is the issue impacting?
- How does the organization begin triaging and fixing the issue?
- Who needs to be alerted?
- Who is responsible for this issue?
Sometimes this information is obvious. For example, Dynatrace organizes entities into management zones and can tag them with important information, such as the owner and environment.
However, Dynatrace can often miss crucial pieces of the puzzle because humans haven’t told it about whole processes occurring on the “human” side of the environment.
Dynatrace Davis automatically discovers what’s machine knowable
Dynatrace Davis is the causation-based AI engine that drives issue detection and root cause analysis in Dynatrace.
When issues occur, Davis scans the known dependency map to identify both root cause and impacted entities based on data it knows.
Davis understands what it can “see.” Such a holistic lens on your business means better problem detection, quicker fixes, and better business outcomes.
On its own, Davis has an excellent picture of the technical environment (Kubernetes clusters, serverless functions, VMs, and so on). But what’s often missing is the “human” element.
For example:
Releases
- Who authorized this release?
- Who performed it?
- What is the rollback procedure?
- To whom should we escalate if it goes wrong?
Configuration changes
What configuration changed is often machine knowable, but:
- Why was it changed?
- Who approved the change?
- Is there a known way to disable the change?
Offline processes
- Are complaints flooding the call center and impacting an application?
- Are customer satisfaction (CSAT) scores decreasing?
- Are app store ratings rising or falling?
When Davis is aware of these items, it can consider them using its root-cause detection algorithms. Additional context makes it easier to detect root causes and understand the impact on the business.
Root cause analysis in action: CPU saturation
The problem report below shows Dynatrace correctly detecting a CPU saturation event on an Ubuntu node. However, it’s difficult to understand the human factors that may have influenced this issue. For example, we can’t determine the answer to the following questions:
- Did anyone make a change that caused this to occur?
- Who approved the change?
- To whom does Ops escalate this issue?
- Which team should investigate this issue?
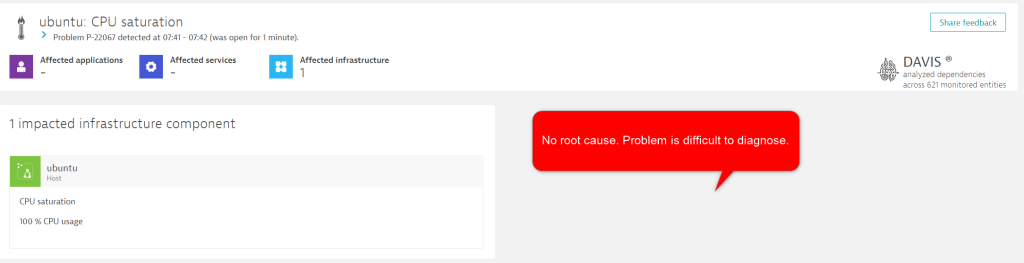
Davis has detected an issue, and within three clicks, we can understand that the stress process caused the issue. However, this problem record is missing the critical human factor data and will be sent to external tools without it.
Improved root cause analysis
You can dramatically and easily improve this problem report using the Dynatrace events API.
The build system sends an automated notification to Dynatrace just before initiating a deployment on this VM. This same concept also works for configuration changes.
The build system adds valuable information, such as:
- The approver of this deployment and their contact details.
- The escalation contact details for this release.
- The operator (or who actioned this change).
- A hyperlink to the ticket and change number for a full history and discussion of the background.
- Any other key/value information you consider important.
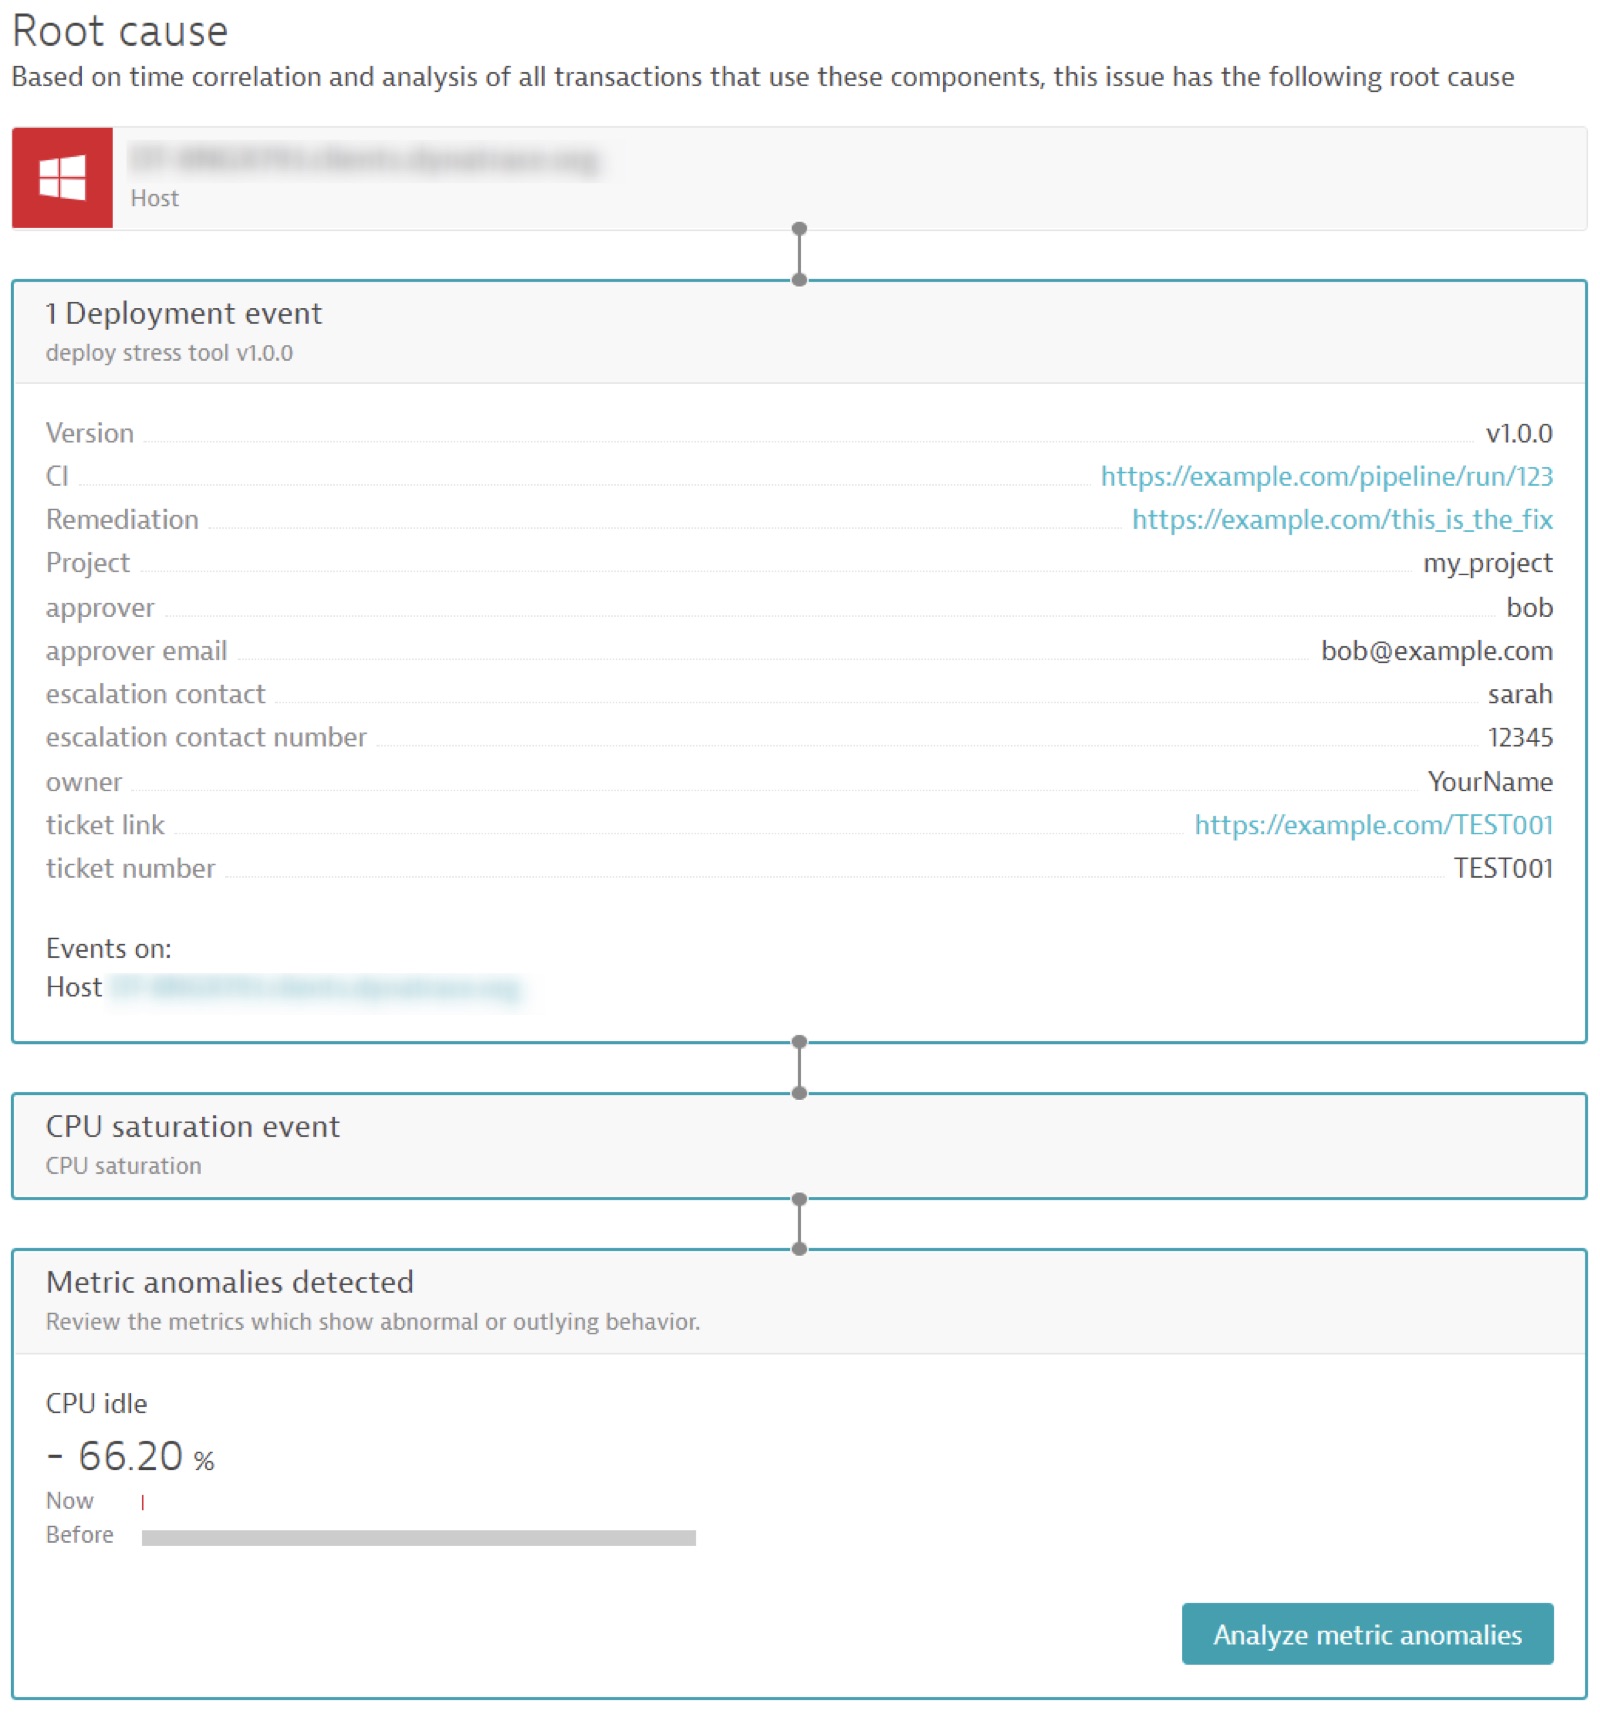
Not only has Davis automatically surfaced this in the problem ticket, but it automatically and correctly identified the deployment as the root cause of this CPU issue.
Downstream incident tooling now has access to this critical information in context of the problem—the system can automatically raise and route tickets to the correct teams. It can trigger automated workflows to resolve known issues. Operations teams know exactly why a problem occurred, who to talk to, and how to fix the problem.
Demo: Add the human factor using the Dynatrace events API
Screenshots are great, but here’s how you can enrich problem reports by adding the human side of the equation.
-
- Create a new VM for this exercise and install a Dynatrace OneAgent.
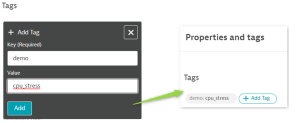
- Tag your host with
demo: cpu_stress
- Install the stress package on the VM (for example:
sudo apt install -y stress) - Create a Dynatrace access (API) token with
events.ingestpermission- In Dynatrace, go to the Access Tokens menu
- Select Generate a new Token
- Provide a name for the token
- Type
events.ingestin the Scope box and select that permission - Click Generate Token
- Note this token and keep it secure (it is sensitive)
- Craft and send an HTTPS POST request to Dynatrace as follows:
curl -X POST 'https://********.live.dynatrace.com/api/v2/events/ingest' \ -H 'Authorization: Api-Token ' \ -H 'Accept: application/json; charset=utf-8' \ -H 'Content-Type: application/json; charset=utf-8' \ --data-raw '{ "eventType": "CUSTOM_DEPLOYMENT", "title": "Running Stress Tool", "timeout": 5, "entitySelector": "type(HOST),tag(demo:cpu_stress)", "properties": { "dt.event.description": "Demo to show the power of Dynatrace events...", "dt.event.deployment.name": "deploy stress tool", "dt.event.deployment.project": "my_project", "dt.event.deployment.release_stage": "production", "dt.event.deployment.release_product": "my_website", "dt.event.deployment.version": "v1.0.0", "dt.event.deployment.remediation_action_link": "https://example.com/this_is_the_fix", "dt.event.is_rootcause_relevant": true, "dt.event.deployment.ci_back_link": "https://example.com/pipeline/run/123", "owner": "YourName", "approver": "bob", "approver email": "bob@example.com", "escalation contact": "sarah", "escalation contact number": "12345", "ticket number": "TEST001", "ticket link": "https://example.com/TEST001" } }' - Run the stress tool, ensuring the -c parameter matches the number of vCPUs on the VM to fully stress the VM, as follows:
# Run stress to max out CPU

stress -c 10 -t 5m
Dynatrace generates an event notification and creates the problem record.
Ingesting data will increase the context and knowledge that Davis has access to and in turn, increase the likelihood of an accurate root cause being detected.
Get started by pushing your pertinent information using the Dynatrace events API.
How to add the human factor into your root-cause analysis
If you’re already a Dynatrace customer and want to learn how to use Dynatrace APIs to integrate the human part of the equation into your root cause analysis to further automate your incident response, reach out to the Dynatrace ONE team.
If you’d like to learn more about how Dynatrace helps organizations automate incident response and root cause analysis, join us for the on-demand Performance Clinic, Automated root cause detection for external data sources with Dynatrace Davis AIOps.


Looking for answers?
Start a new discussion or ask for help in our Q&A forum.
Go to forum